
Carlos at Quantitativo rebuilt my triangulated stat arb strategy last week. From scratch, off nothing but the six-part series I put out on it, and he got a gross Sharpe of about 2.4 out the other end.
Go and read it. Good work, and there’s a lesson in there that I want to pull out before I go anywhere else.
Pair selection is most of the game.
He started by picking pairs on GICS industry classification. Sharpe of about 1.6. Wasn’t happy with that, went back, changed how he was selecting pairs, came out at 2.4. That’s a lesson in itself. Good pair selection really moves the needle.
So: everything in his piece is right as far as it goes. What follows is the stuff I’d have told him if he’d asked, most of which we only worked out in the ten months or so we’ve been trading this thing live.
Triangulated stat arb works by flattening your spreads down to ticker-level signals. Each ticker ends up with a bunch of votes, one for each pair it turns up in. Some votes say it’s trading rich. Some say cheap.
The obvious next move, which admittedly I originally made without thinking terribly hard about it: score how much they agree. Sign of each spread’s signal, average them, take the absolute value. If every pair points the same way, you get 1.0. Even split, zero. Five out of six, about 0.67.
I call it “consistency”. Weight your signal by consistency, and the book tilts towards whatever the network is surest about.
Intuitively it makes sense. Trust the things that agree more. And it works.
Which is probably why I ran it for ages before getting round to asking how much agreement really matters. A good place to start is asking how much agreement you’d expect from chance alone.
Imagine nothing is mispriced and every vote is pure noise. Every vote’s a coin flip then, and a unanimous ticker is just all the coins landing the same way up. Two coins do that half the time. Three, a quarter of the time. Four, one time in eight; five, one in sixteen; six, one in thirty-two.
Which means a consistency of 1.0 on a ticker with two connections is something you get by chance alone every second time you look. The same 1.0 on a ticker with six is a one-in-thirty-two event. Identical consistency. Almost no information in the first case, loads in the second.
Though don’t get carried away with the one-in-thirty-two either...
Run your eye over a hundred depth-six tickers and three of them come up unanimous by chance alone. The point is that it’s not a discovery about any particular stock. It’s a noisy effect that works out in the long run and on average because you do it many times.
The coin analogy gives us something more useful than a probability too. Let me show you what I mean...
Six coin flips. The mean heads count is 3, standard deviation about 1.2. So six heads in a row is three above the average, which puts it 2.4 standard deviations out. Using any number of coins, that generalises to the square root of however many you flipped.
Which is exactly consistency times the square root of depth! (since unanimity is just consistency equal to one.)
In geek speak, it’s the standardised binomial deviate. And it gives us a sigma count (measuring how unusual it is to get total agreement at a given depth) with no free parameters. Which is nice.
And consistency can’t go above 1 because it’s the absolute value of the mean of the signs, and the signs can only be +1 or -1. That means that the sigma count maxes out at the square root of the ticker’s own depth. A stock that appears in two pairs tops out at 1.4. Three at 1.7. Four at 2. etc.
A perfect run is a perfect run at any depth. What changes is how far from chance that perfect run is. And four is the first depth where a perfect run can be a 2-sigma event at all.
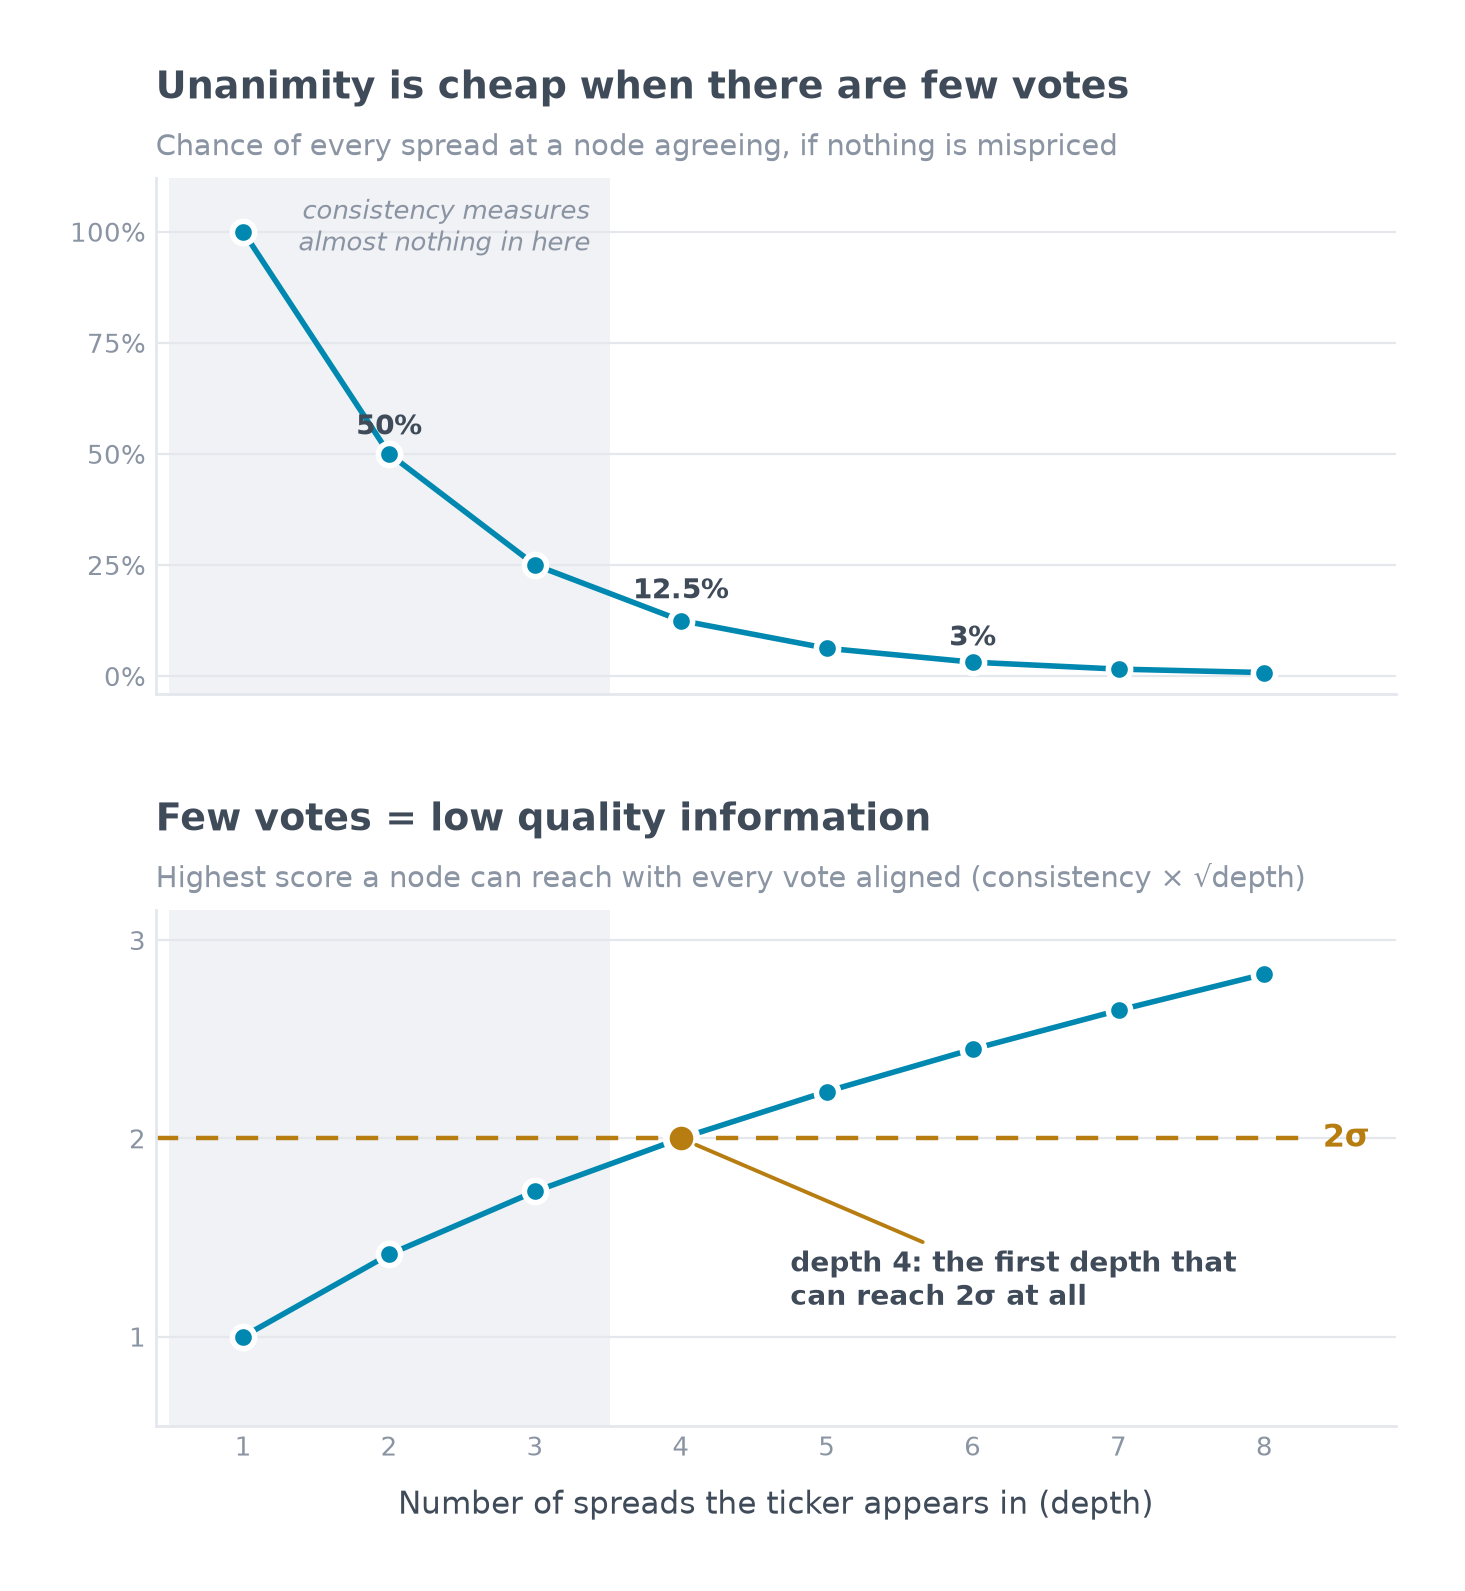
So those depth thresholds you’d reach for on instinct aren’t arbitrary after all. A depth threshold is really an evidence threshold, and you can put a number on it (kind of... see the caveats below).
Our own data says the same thing. Across depths one to three, the median agreement is the maximum. Most thin names are already unanimous. Which is what you’d expect, given that down at depth two, unanimity is two coins coming up the same way, and about half of them do.
Measured at matched divergence on the universe we actually trade, anything at depth three or below earns about 2 bps. Go deeper but fail to clear two sigma and you earn... about 2 bps. That suggests that depth on its own buys you nothing whatsoever. Clear two sigma at depth four or more and it’s roughly three times that.
Originally, I got this answer empirically when I was exploring implementation trade-offs. I was trying to figure out whether depth or consistency mattered more, and the data unambiguously showed that they interact - that consistency only matters when depth is at least 4. The answer was available from first principles all along, but it only occurred to me much later (during a RW Pro webinar, actually, which took us off on quite the tangent).
One caveat for all the purists out there who are surely screaming at me through their screens right now. The votes aren’t independent. A ticker is shared among many pairs by construction, and the tickers share factor exposures as well. So agreement is going to happen more often than you’d expect, and the threshold for “this carries real information” is therefore higher. But practically, I don’t think it matters all that much. Depth and consistency can only take on a certain set of discrete values, so you can’t be overly precise anyway.
The point is that it doesn’t change the practical takeaway. A consistency score with no reference to depth mixes genuine signal with pure noise, which dilutes the signal. Useful conviction can only happen at the dense nodes. The sparse ones are more like coin flipping. Average them together and the good stuff gets watered down by the rubbish, and the number that comes out will look entirely sensible... just way worse than it could otherwise be.
I’ve always thought about long/short portfolios in terms of the number of tickers in the universe you’re trading as the starting point. If I can realistically trade N tickers, then I want to weight those N tickers in proportion to their signals.
But this strategy is weird in a few ways. Here, your universe size is a reflection of the depth threshold you’re willing to tolerate.
Say your pair selection pipeline (which of course is 80% of the game) spits out 500 pairs. Those 500 pairs flatten to 200 names. Those 200 names will have varying depth. Some will appear in only one pair, some will appear in 2, 3, maybe 10 or more!
So you can’t just say “give me the top 100 flattened names.” You’d be accepting an arbitrary minimum depth, which is just adding noise.
Rather than prescribing your tradeable universe size, you’re better off prescribing the minimum depth you’ll accept and taking whatever you can get. If that clears your desired universe size, great, but it might not. The point is that the minimum depth you accept should be a consideration.
A sensible implementation on our pair selection pipeline gets an after-cost Sharpe around 2.7 at eighty names, if you’re on a good deal with Interactive Brokers (this is an insane Sharpe, I know, and I didn’t believe it until I’d had others in the Pro group build it and give me a comparable number. Even then, I was convinced we’d all done something wrong. But I digress...). At 150, it drops to something like 1.2. It’s the same signal, same code, same starting universe of pairs. The only thing that changed was how much evidence I was prepared to let in the door in order to get that bigger tradeable universe.
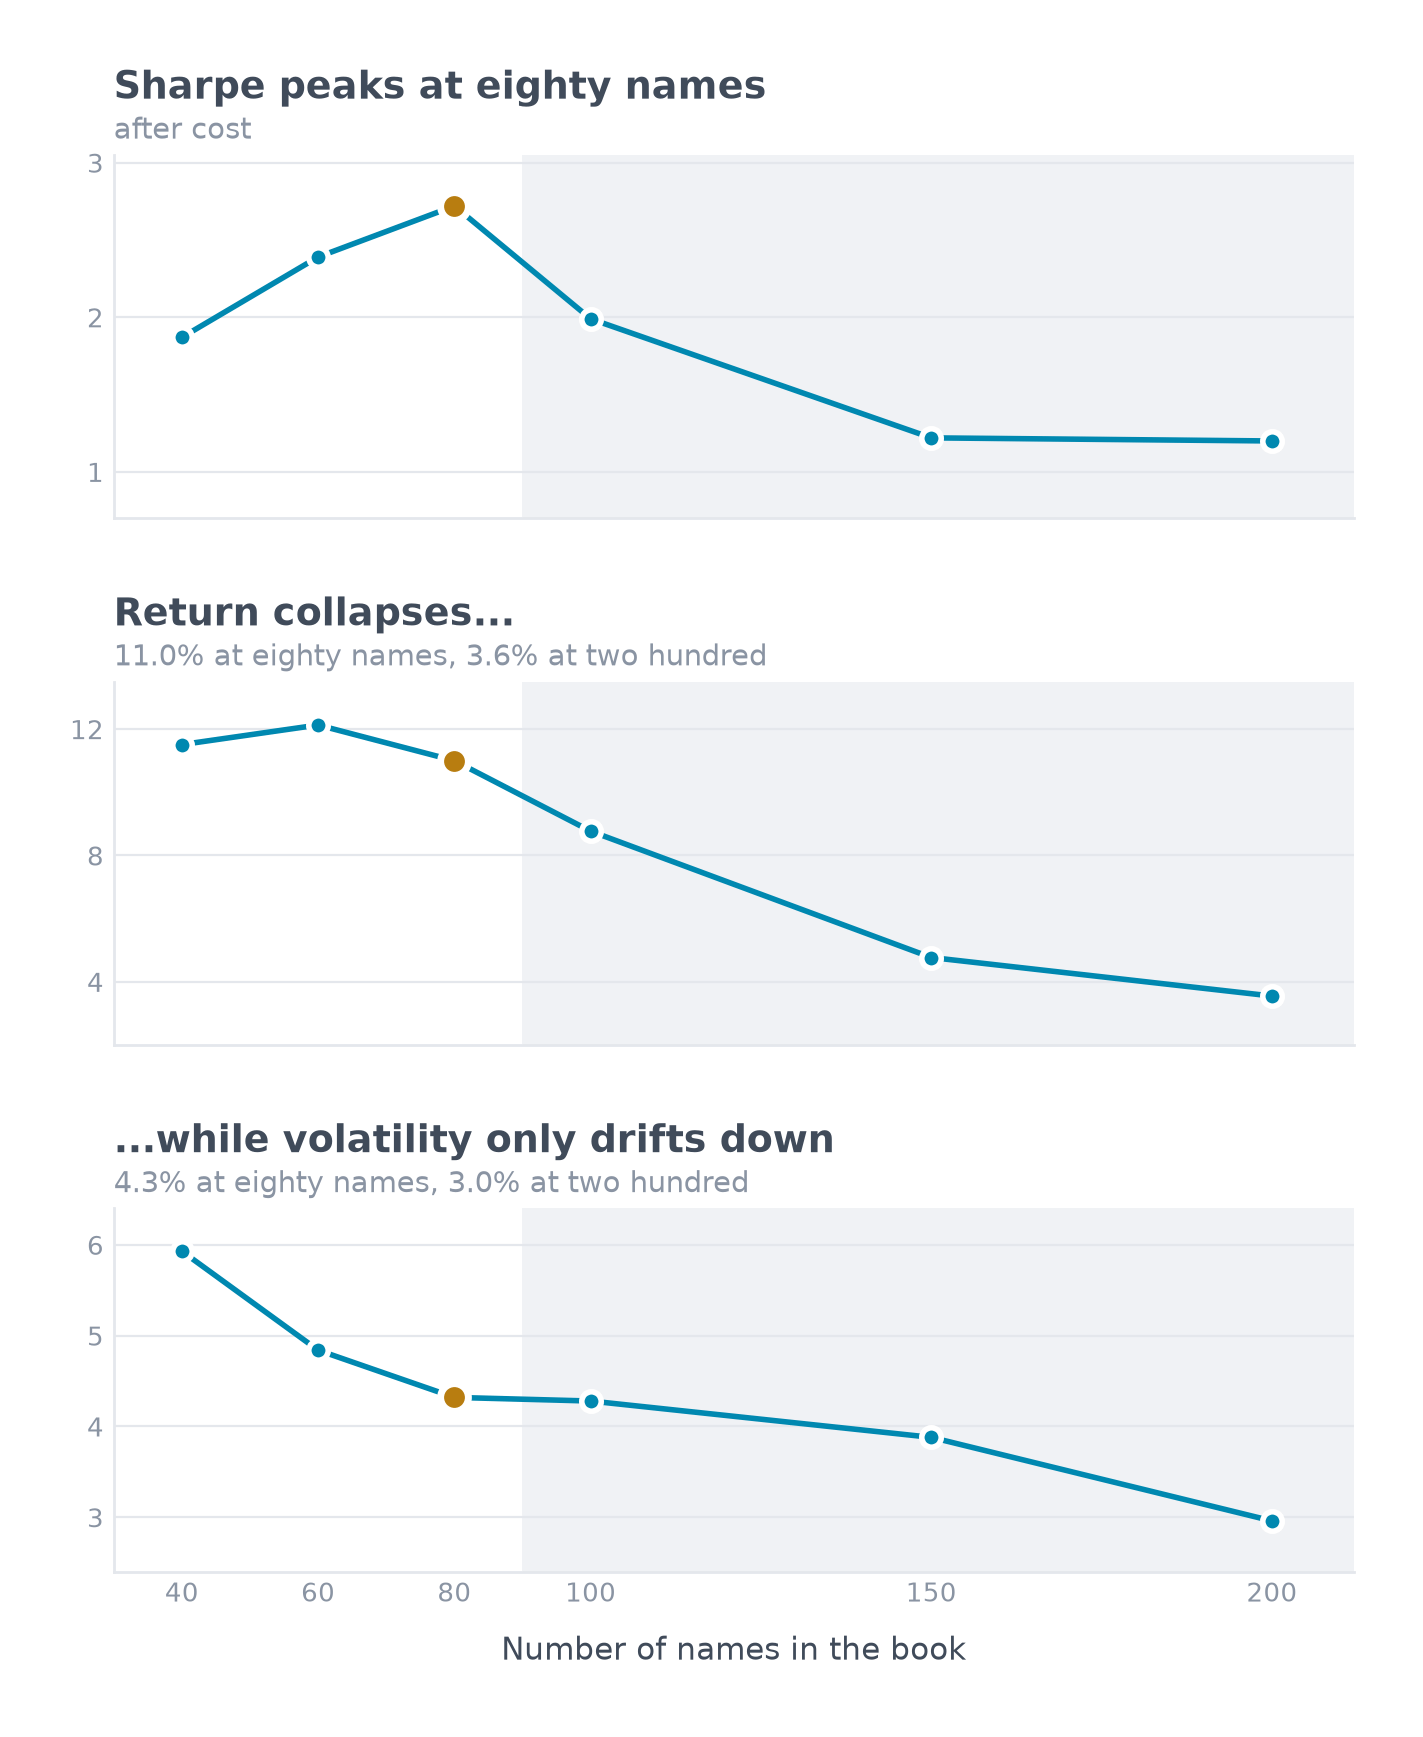
Using the pairs universe our pipeline identifies, you can build a portfolio of 80 tickers with a minimum depth of four in most months (we refresh pairs monthly). That means that the agreement/consistency scores carry real information. But if you push for 150, say, you’re forced to dip into the depth 2 and 3 tickers. You end up filling half the portfolio with tickers whose unanimity can’t be distinguished from luck. And you see the simulated Sharpe drop dramatically.
So you could build the portfolio the other way round. Decide what your minimum acceptable depth is. That gives you an implied “minimum standard of evidence,” so to speak. Then, simply take however many tickers meet or beat that threshold. The book size is then whatever that number turns out to be. A variable-size book has problems of its own (it has implications for concentration, for example), but I don’t think they’re insurmountable.
Another obvious solution is to find more good pairs. That’s an open research thread for us at the moment, and probably always will be (it’s 80% of the game after all).
Normally I’m allergic to talking about performance numbers in public. No better way to bring down the wrath of the market gods and be taught the lesson of humility.
But I’ve heard a few people talk about their results with this approach, and a useful data point is whether different implementations of the same idea end up realising similar performance. So here’s what the sims and the live numbers look like.
The implementation I’m running backtests, after costs, at a Sharpe of about 2.7 with moderate unlevered total returns (~11%). That’s dependent on costs, how you build the portfolio, how you convert the signal to a weight, how you manage turnover (which is high), and a bunch of other details.
Backtests tend to be optimistic, and mine are not the exception.
But we started trading this late 2025, and in that time it’s delivered a Sharpe of over 3. Yes, you read that right. Yes, I’ve gone and jinxed it and the next time I write about it it will probably have died.
Of course, we’ve just been in a lucky patch. Periods like this come and go. You don’t read anything much into ten months of trading. Longer term I’d expect it to go at a Sharpe in the high 1’s, maybe.
Anyway, the reason I’m saying this now is that people are talking about how it’s gone for them, and our experience very much aligns with theirs, both in simulation and since we took it live. So that’s a nice data point. Our implementations will surely be different (there are many moving parts to this thing and many ways to capture the edge), so it’s a small but useful piece of validation that the edge is real. The underlying mechanism backs it up as well.
I imagine the strategy gets a bit of interest now that people are talking about it. So it probably starts to decay in the not-too-distant future. Such is the nature of trading these sorts of edges... we make hay while the sun shines, and then we go find the next thing.
There’s a big flaw in this strategy and I’m sure you’ve spotted it. Certainly, anyone who’s traded it will know exactly what I’m talking about.
Some divergences just don’t converge.
The good kind of divergence is one that happens on price-insensitive flow. Someone trading for reasons that aren’t about maximising short-term returns. All the usual suspects - a fund squaring up a mandated exposure, a forced liquidation, someone deciding they want to own a big chunk of something and they want it right now. That’s the sort of move that tends to revert. The underlying value of the thing hasn’t changed, but the supply/demand imbalance has changed the price. Markets being what they are (an efficient pricing machine), price tends to converge to fair value. I wrote about the mechanism here.
The other kind of divergence is one driven by a change in price that reflects a real change in value. An earnings beat or miss is the classic example, but any new information that changes what the thing is worth has the same effect.
These kinds of divergences tend not to come back because the new price reflects the actual value. But from the perspective of a network of z-scores, these types of divergences look just like the good kind. The network can’t tell a forced seller from an earnings miss and will treat them both the same way. It needs information from outside the network to do that.
Prime example: TRV (an insurer) recently beat earnings by a whopping 80-something percent and did exactly what you would expect it to. The network lit up and screamed “TRV short” but of course that would have been a terrible trade. It repriced on genuine news. Sure, it might overshoot, but it’s more likely to undershoot. At the very least, it’s not the screaming short the network thinks it is.
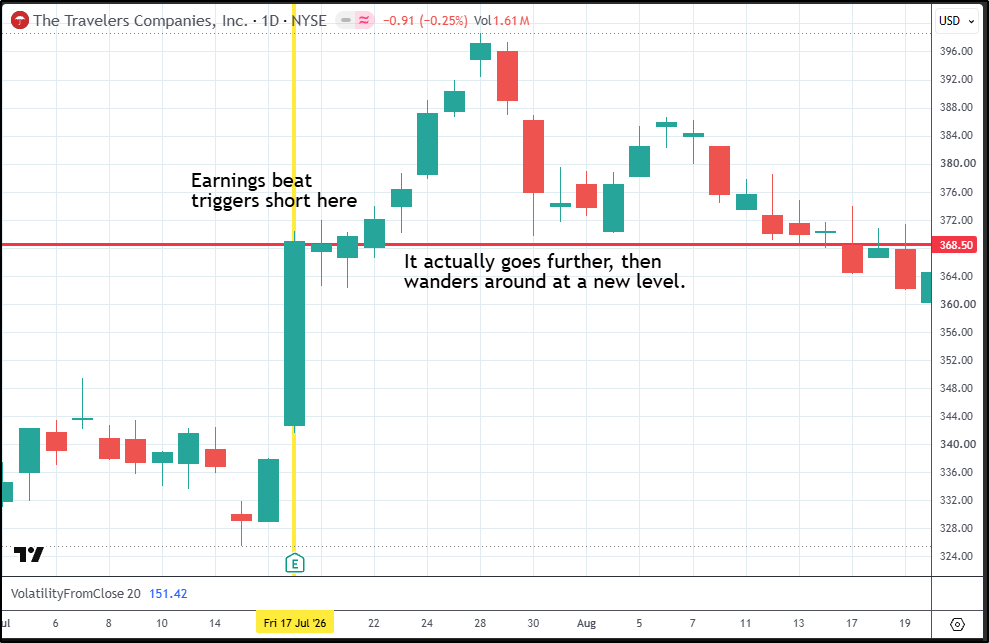
Once you’ve sorted out how to build the portfolio so it carries as much of the network’s information as possible, this is the highest-value problem left. And better maths won’t make any difference. What you need is to know a name is about to report, or has just reported, and to act on that before the divergence ever gets into the book at all. Which is as much about data and infrastructure as it is about research.
So, you need an earnings feed. And on top of it:
Corporate actions history, or your divergences end up measuring a stock split, or a merger target and its acquirer both end up in your book (which is essentially the same position twice)
A point-in-time universe rather than today’s list projected backwards, or you’ll be trading a lovely backtest of the survivors
End-of-day prices with the adjustments handled properly
Intraday data, the moment you want to do anything other than trade the close (and that is a very good idea here)
Then the part that’s all too easy to forget... which is that all of this stuff breaks. A field in an upstream data source gets renamed. A feed goes down. The list of things that can go wrong is endless. Keeping the infrastructure healthy is a standing job. It’s easy to assume that it’s a project with an end date. But it most definitely is not that.
Example: We recently had a data vendor silently dropping a certain name. Sounds minor, but it happened to be in multiple pairs, which had knock-on effects across the network. So we built a fallback data feed for when that happens again (and it will definitely happen again).
Our infrastructure is fairly mature and well-resourced now (there’s a bunch of other stuff besides the triangulated stat arb resources hanging off it). The build and early troubleshooting was literally a full-time job. The maintenance is now equivalent to a part-time job. But it’s significant, and it’s ongoing.
And the data/infrastructure is only one part of the problem. Working out what to actually do with an earnings feed took a pile of research, most of which didn’t work, and that’s been grinding away in our Lab for a while now. A decent chunk of it has come from members rather than from me. Somebody built a corporate-action scanner (thanks Michael - love your work) and shared it around. The earnings-surprise endpoint we all pull from is the result of research that several people contributed to, and that anyone in there can run themselves.
You can build every bit of this yourself, but gee it’s easier when you can share the load.
Carlos has just built a good chunk of it in a few weeks. We built the rest over a few years. Neither of us is special. All I’d say about it is that I’ve spent more of the past few years being a data engineer than I ever meant to, and not one of those hours turned up in my P&L. There’s a lesson in that.
The idea was never a secret. Nor is the pipeline, really. It’s just expensive, and requires ongoing attention (like my eldest child, now that I think about it).
We resource the whole thing for RW Pro members, for less than licensing the data on your own would cost you, and the stat arb stuff is one small part of what’s in there.
Carlos is going to trade his version live, and we’ve agreed to write it up together when he does. We’ll be able to compare two implementations for capturing the same edge, built by two people who’ve never worked together, running on the same market at the same time. I’m curious about where the two books disagree and why. No doubt we’ll learn from each other’s implementations.
In the meantime, I’ll continue to improve and evolve this particular strategy and everything else we do in RW Pro.
The part I keep coming back to is the distinction between agreement and evidence. A signal can look remarkably consistent while still carrying very little information if the support underneath it is thin. The same apparent agreement at greater depth can mean something very different. And once correlation between the inputs is considered, the question becomes even more interesting: not simply “how many signals agree?” but “how much real evidence sits underneath that agreement?” That seems like a useful distinction far beyond this particular strategy.