
Statistically Significant and Chronically Late
How I learned to stop worrying and trade without p-values
Statistical tests aren’t of much help in trading. Not because they’re inherently bad (they’re not) but because markets are too noisy for them to tell us anything of practical use.
You’ll get three things from this article:
First, you’ll understand why detecting regime changes with statistical tests is basically impossible in real time.
Second, you’ll see why waiting for statistical significance before trading an edge often means you’re too late.
And third, you’ll learn what actually matters when evaluating trading ideas.
Let’s dive in.
The Problem: Markets Are All Noise
Here’s a thought experiment my colleague Euan Sinclair put together.
Imagine I’ve got a strategy with a true, long-term return of 10% per year and 20% volatility - roughly the S&P 500’s long-term profile. I’ve been trading it for five years. It’s been working as expected.
Then something changes. Maybe the market microstructure shifted. Maybe the edge just got fully absorbed by the market. Whatever. The point is, my edge disappears. For the next month, my strategy’s expected return drops to zero, but the volatility stays at 20%.
Of course, I’d like to detect that change. I’d like to know when to stop trading the strategy.
So I do what any rigorous, technically minded trader would do: I run a t-test comparing my five years of historical returns to this most recent month. That’s about 1,260 trading days versus 21 days.
Surely that’s enough data to spot a problem?
Hell no!
Here’s why: The expected daily drift for a 10% annual return is tiny - about 0.04% per day. But the daily noise from that 20% volatility is about 1.26%. The noise is thirty times larger than the signal.
Your daily Sharpe ratio is roughly 0.03. That’s an astronomically low signal-to-noise ratio. Even if this edge disappeared entirely, you’d barely notice in a month.
When Euan ran this simulation and tested it with a standard t-test, the p-value came back at 0.12. Not statistically significant. The test found nothing. The collapse in performance didn’t even register as a blip.
He also tried a Kolmogorov-Smirnov test - a non-parametric version that looks at the whole distribution, not just the mean. Surely that would catch something? Nope. The p-value was 0.37. Even worse.
(Euan goes deeper in his article - you can read it here)
To make this more real, I simulated 10,000 5-year artificial stock price histories using a GBM process with 10% annual return and 20% volatility. For each price series, I then simulated a month where the returns dropped to zero but the volatility remained unchanged. I performed a t-test on each price history to see how often it detected the change in the underlying process and plotted a histogram of the results.
If the test was useful, I’d see it working most of the time. That would show up as a spike in the left extreme of the histogram.
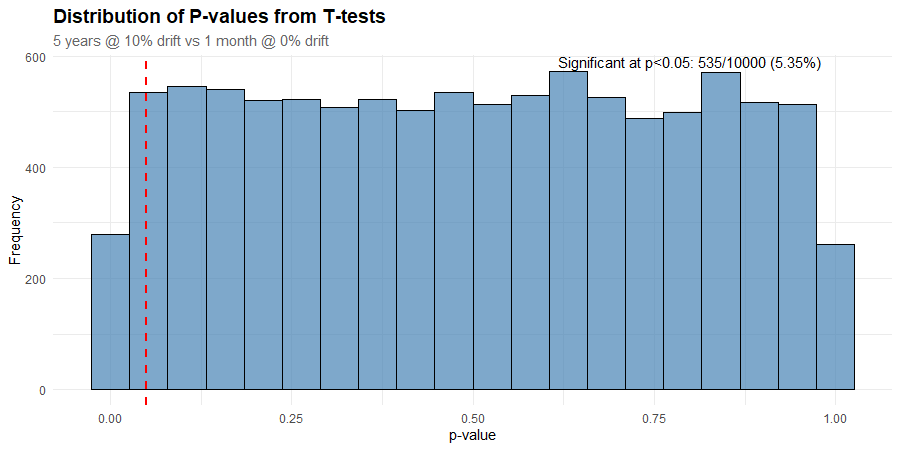
Instead, the p-values are roughly uniformly distributed (notwithstanding the top and bottom buckets). That suggests that any p-value is just as likely as any other. Which means that the test has no ability to distinguish between the two regimes.
We get 5.35% of p-values less than or equal to 0.05, which is essentially what we’d expect from random chance alone.
It Gets Worse
Here’s the “funny” part: In Euan’s simulation, that “dead” month (the one where the edge had completely disappeared) still managed to return +7.5%.
That’s right. A zero-EV month beat 93% of all months during the prior five years of positive-EV data (EV = expected value, or average result if you could repeat the observation infinitely).
How is that possible?
A 20% annual volatility translates to roughly 5.8% monthly volatility. Even with zero drift, random chance will give you a +5.8% month about 16% of the time. A +7.5% month (about 1.3 standard deviations) happens roughly 10% of the time purely by chance.
Meanwhile, in the “good” regime with a 10% annual return, the expected monthly gain is only +0.8%. So a lucky +7.5% month easily beats the vast majority of historical months.
You end up with this bizarre headline: “Our strategy just lost its edge, but had its second-best month ever.”
Noise does that.
The Pattern Holds Across Thousands of Simulations
To make sure this wasn’t a fluke, I ran 10,000 simulations of the same setup. The results are shocking:
The median one-month return (with zero drift) was about -0.017%, but the 90th percentile was +5.9%.
In half of all runs, the zero-drift month beat 44% of historical months.
In 17% of runs, it beat more than 80% of prior months.
In 9% of runs, it beat more than 90%.
Remarkably, in 1.2% of runs, the zero-drift month was the best month.
So one in every eleven “dead” months looks like a top-decile success. One in every 82 dead months looks like the best month out of the last five years!
Here’s a visual representation. This density plot shows where zero-drift months land when ranked against 60 months of positive-drift history, across 10,000 simulations.
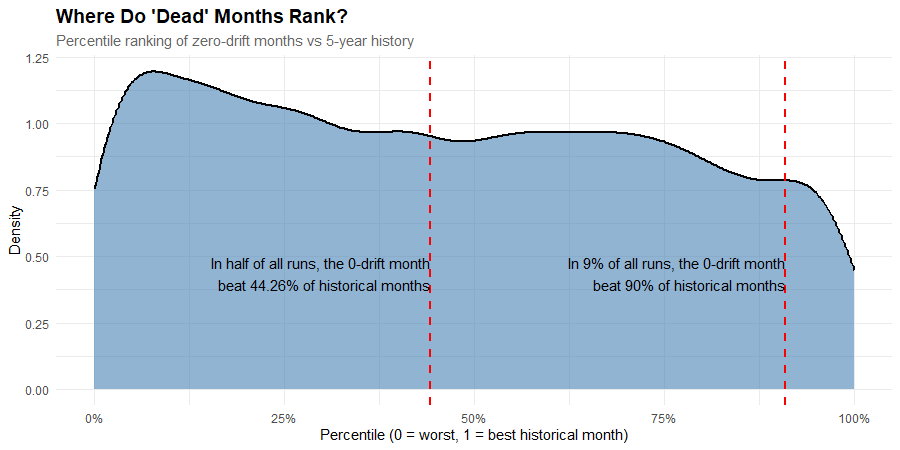
If zero-drift months consistently ranked near the bottom, you’d see a sharp peak on the left side of this chart. Instead, we have a low peak, a gentle slope, and a near-uniform distribution across the middle.
That means a “dead” month is marginally more likely to rank in the 10th percentile than the 90th, but it’s essentially equally as likely to rank in the 25th as the 75th.
The distribution reveals why statistical tests fail: one month of returns from a broken strategy looks essentially identical to one month from a working strategy.
The signal is completely drowned out by noise.
We don’t have a detection problem. We have a “you can’t tell the difference” problem.
Being Better at Statistics Doesn’t Help
When I learned about the t-test’s weakness, I tried non-parametric tests like Kolmogorov-Smirnov. Surely that’s more robust?
No. When two normal distributions differ only slightly in mean but have the same variance, the KS test has less power than the t-test. It’s designed to catch shape differences - fat tails, variance shifts, asymmetry - not small mean drifts.
Sharpe ratios, t-tests, and p-values were designed for large-sample, low-noise situations. Financial returns are the opposite: small signals, fat tails, short samples.
These tests need thousands of data points to hit statistical significance, given the level of noise in our data, so they’ll never detect regime shifts in anything close to real time. The market will move on long before statistics catch up.
It Gets Worse Again
OK, I’m really laying on the pessimism here. But bear with me because it does get better eventually. Spoiler alert - there is a solution to this problem.
Even if statistical tests could reliably detect when strategies stop working, that wouldn’t solve your problem. Because by the time an effect shows up as statistically significant in your tests, everyone else has spotted it too.
The edge is eroding, and has been for some time.
Think about new markets. When crypto perpetual futures first gained popularity, there was no way to run meaningful statistical tests on funding rate dynamics. The product design was new. The data didn’t exist yet.
But traders who understood similar mechanisms from traditional markets could immediately spot and exploit the inefficiencies without waiting years for data to accumulate.
They had a reason to expect the edge would exist.
Often, the best opportunities in trading exist in places where you can’t get any kind of statistical significance. And the very best tend to be where there’s basically no data at all.
Getting comfortable trading under massive uncertainty, because the logic makes sense based on other things you know, is where systematic trading departs from traditional data science.
What I Do Instead
I’m not saying you should trade blindly based on hunches. I occasionally use statistical tests myself. I even show a useful Bootstrap test in my Bootcamp course. But the reality is that in a low signal-to-noise, fat-tailed environment, these tests rarely give you much additional information. At best, they’re a tiny piece of evidence. But that evidence is swamped by better evidence - such as a credible reason for the edge to exist.
Here’s what I focus on:
1. Have a strong and credible basis for the effect:
This is by far the most important thing.
If there’s a credible reason for the trade to exist - a risk premium, something structural, forced flows from rebalancing - then that provides solid evidence.
Risk premium: People paying you to take risks they don’t want
Forced flows: Price-insensitive buying and selling (for example, from fund redemptions or index rebalancing)
If you understand why something should work, you can trade it with more confidence than if you only know that it has worked in the past.
2. The hypothesis should be supported by whatever data you do have:
Use simple analysis techniques to look as directly at the effect as possible.
Is it persistent over time?
Does it show up where you expect and not where you don’t?
Simple scatter plots and aggregations are often enough to reveal useful patterns. For example, you don’t need a p-value of 0.05 to see that relative equity/bond performance tends to revert.
The Practical Reality
When a strategy underperforms for a few weeks, you face two potential errors:
Type I error: You think it’s dead when the underperformance is just noise. You abandon a still-valid edge.
Type II error: You think the underperformance is noise when it’s actually dead. You bleed transaction costs and take on unrewarded volatility.
Statistics tries to balance those errors - but they’re horribly lagging indicators. They confirm what you already know, long after it’s actionable. A strategy doesn’t announce its death with a p-value. It fades, subtly, while your t-statistic bounces around all over the place.
So if you can’t rely on statistics in a practical sense, what can you do?
Trading is Pragmatic
We need to be pragmatic about our objectives and honest about what we know and what we can control.
Our objective is simple: to turn money into more money at a level of risk that we can tolerate.
What do we know?
That there’s evidence (but no guarantees) that our strategies are positive EV (they’re grounded in reality and supported by data)
That returns are noisy, especially in the short-term
That our returns don’t tell us if a strategy is working or not at any time scale we care about
What can we control?
Our exposures (position sizing)
What we choose to trade
To be really clear, these are things we don’t know or can’t control:
We don’t know with certainty if our edge has disappeared (or was even present in the first place)
We don’t know what returns the market will throw up
This pragmatic reality informs my entire approach to trading:
Trade as broadly as possible
We all know that diversification helps smooth out your portfolio returns. When one strategy zigs, another zags, and your overall volatility tends to come down.
But there’s another underrated reason to trade broadly - it reduces the chance of trading without an edge.
Remember, we don’t know with certainty that a strategy is still working, or if it ever worked at all. So, trading more good edges increases our chances of having an edge at the portfolio level.
Stack the odds in your favour
But don’t just trade any old thing. Do the work to ensure that anything you do trade is likely to have a real edge:
It’s based on a real phenomenon
It shows up in the data
You have reason to think you can compete
Trade at a sensible size
If I’m wrong about something having an edge (and I will be wrong sometimes), it hurts me through transaction costs and unrewarded volatility.
Nothing I trade is particularly expensive (low frequency, liquid assets, for the most part), so I’m not too worried about transaction costs.
But the last thing I want is for some edge that I’m wrong about (or any edge, for that matter) to be sized so big that its returns dominate the portfolio.
So I think about how big a strategy needs to be to contribute a certain amount of volatility, on average.
How much volatility?
Depends on the strategy. I typically start with equal volatility as a baseline assumption, and then size things up or down based on what I know.
Is it an edge that I’m confident will persist because it’s based on risk preferences? It gets a little more weight. Does it have negative skew, like selling volatility? It gets down-weighted some. You get the idea.
Turning strategies off
I’ve tried all sorts of statistical approaches for turning strategies off based on P&L. None of them tell you anything worth knowing on a time scale you care about.
Let’s say you have a bad month and are worried.
Given that you’ve done the work and have satisfied yourself that there’s a good reason for the edge to exist, you’re sized such that being wrong can’t hurt you very much, and that your short-term P&L tells you nothing useful, the best approach is to:
Make sure you have the correct positions on and are comfortable with your sizing.
If you’re not, then adjust accordingly.
Relax
Give it time for the edge to play out
Focus on finding new things to trade
If you’re really worried, you’re almost certainly sized too big. Given that you have good evidence for the edge, err on the side of turning it down rather than turning it off.
Agonising about short-term P&L is essentially wasted energy. It won’t help you one bit. On the other hand, finding more things to trade will help a lot.
Focus obsessively on what you can control.
Relax about the rest.
Summary
I tried using statistical tests to “confirm” an edge or tell me when a strategy stopped working. Turns out, that’s impossible on any timescale that matters.
Markets are too noisy. By the time a test shows statistical significance, everyone else has spotted the problem too - and the best part of any new opportunity is already over.
So here’s what I do instead:
I start with edges that have a credible reason to exist - risk premiums, forced flows, structural inefficiencies. If I can’t explain why someone would pay me to do something, I don’t trade it (usually).
Then I look at whatever data I have. Not to achieve some arbitrary p-value, but to see if the effect shows up where I expect it to, and doesn’t show up where I don’t. Simple scatter plots and basic analysis are usually enough.
I trade as broadly as possible because diversification does two things: it smooths returns, but more importantly, it reduces my chance of trading without an edge. If I’m wrong about one strategy, it won’t kill me.
I size things sensibly. Equal volatility as a baseline, then adjust up or down based on what I know about the edge. If something has negative skew, I size down. If it’s based on stable risk preferences, maybe I size up a bit.
And when I’m worried, I check my positions, make sure my sizing is still right, and then I relax. Agonising over short-term P&L is wasted energy. Finding new things to trade actually helps.
The right question isn’t “Has my edge stopped working?” It’s “Given what I know, how much do I trust it now?”
The answer is always probabilistic, never definitive.
Taking action in the face of uncertainty is one of the things that makes trading hard… but it’s also why it’s the most exciting game in town.