
Hyperliquid Carry Looks Trendy
Show me the exit liquidity
Key Points:
Different venues, same strategy, different results: The same carry strategy that performed well on Binance consistently underperforms on Hyperliquid.
Digging into why leads to insight: Hyperliquid funding appears to signal informed selling pressure that tends to continue, while Binance funding is more often associated with crowding that tends to revert.
Reality clashing with what you thought you knew is an opportunity: When you notice something that doesn’t align with your view of the world, you have a chance to learn something that can lead to new tradeable insights. Start digging and pulling threads, and see where it leads.
One of the things I love most about trading is the detective work.
You start with a question or observation, try to explain it, follow the evidence, and occasionally stumble onto something genuinely surprising that makes you rethink your assumptions.
That happened to me while I was analysing a crypto carry trade recently.
The data revealed something I didn't expect: the same carry strategy that performed really well on Binance consistently underperforms on Hyperliquid.
Not just a small difference, either. And the reason why gives us a fascinating window into how different market participants can create entirely different market dynamics (at least, if my pet theory is correct - you be the judge).
Quick primer on crypto carry
For those who need a quick primer: carry trades in crypto perps are straightforward. When futures trade at a premium to spot, shorts collect funding payments. When they trade at a discount, longs collect.
The classic carry strategy simply takes positions aligned with these funding payments. It tends to work because, contrary to what efficient markets theory suggests, price movements don't fully offset the funding you earn - in fact, they’re often a return driver in their own right.
This factor plot illustrates the idea:
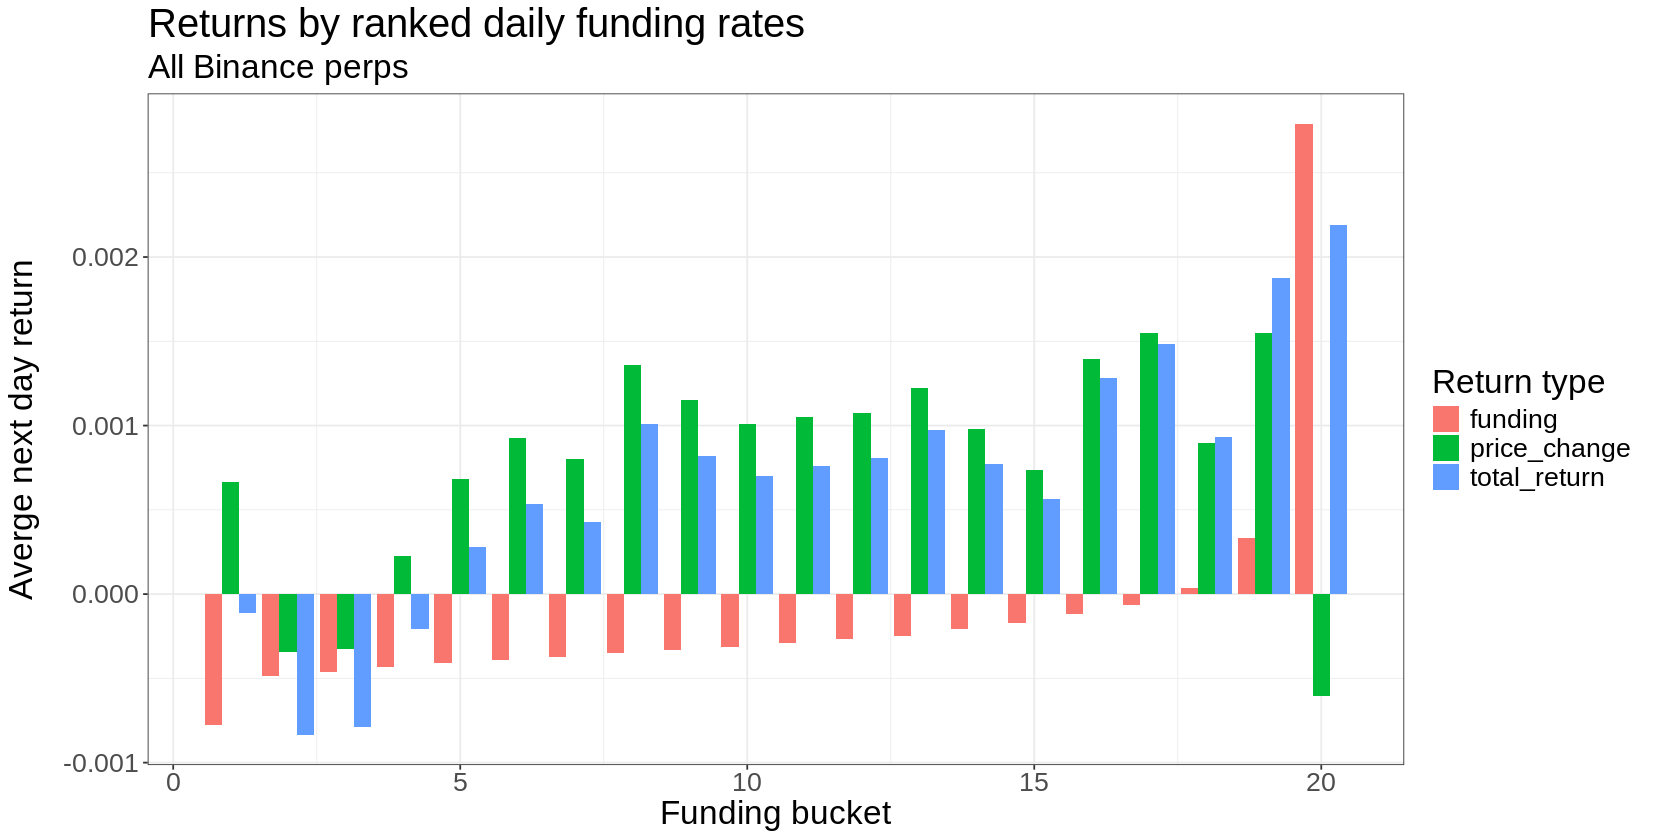
Each day, we rank all the perpetual futures on Binance by their 24-hour funding rate and put them into 20 buckets. The bottom 5% (from the perspective of funding to long positions - a convention used throughout this article) go into bucket 1, the next 5% into bucket 2 and so on.
The bars represent the average next-day returns to the perps in each bucket:
Red bars: funding returns
Green bars: price change returns
Blue bars: total returns
To me, this is a fascinating chart that tells us a great deal while also raising numerous questions.
Funding rates are very predictive of their next-day values (the red bars are almost linear, with extremes in the tails)
Funding rates are also predictive of price change returns
But the relationship is noisier
And it’s flipped in the extremes (buckets 1 and 20)
Funding rates are predictive of total returns
The relationship is most pronounced in the tails (buckets 1-5 and 16-20)
Bucket 1 looks special - the price change returns almost, but not quite, net out the funding returns on average
I’ve been trading crypto carry in different forms for several years, and when I first started doing it, I assumed that you would have to go into the murkier end of the market to make it work.
That is, I assumed that the stuff that finds its way into those buckets at the tails of the factor plot would be the worst of the worst.
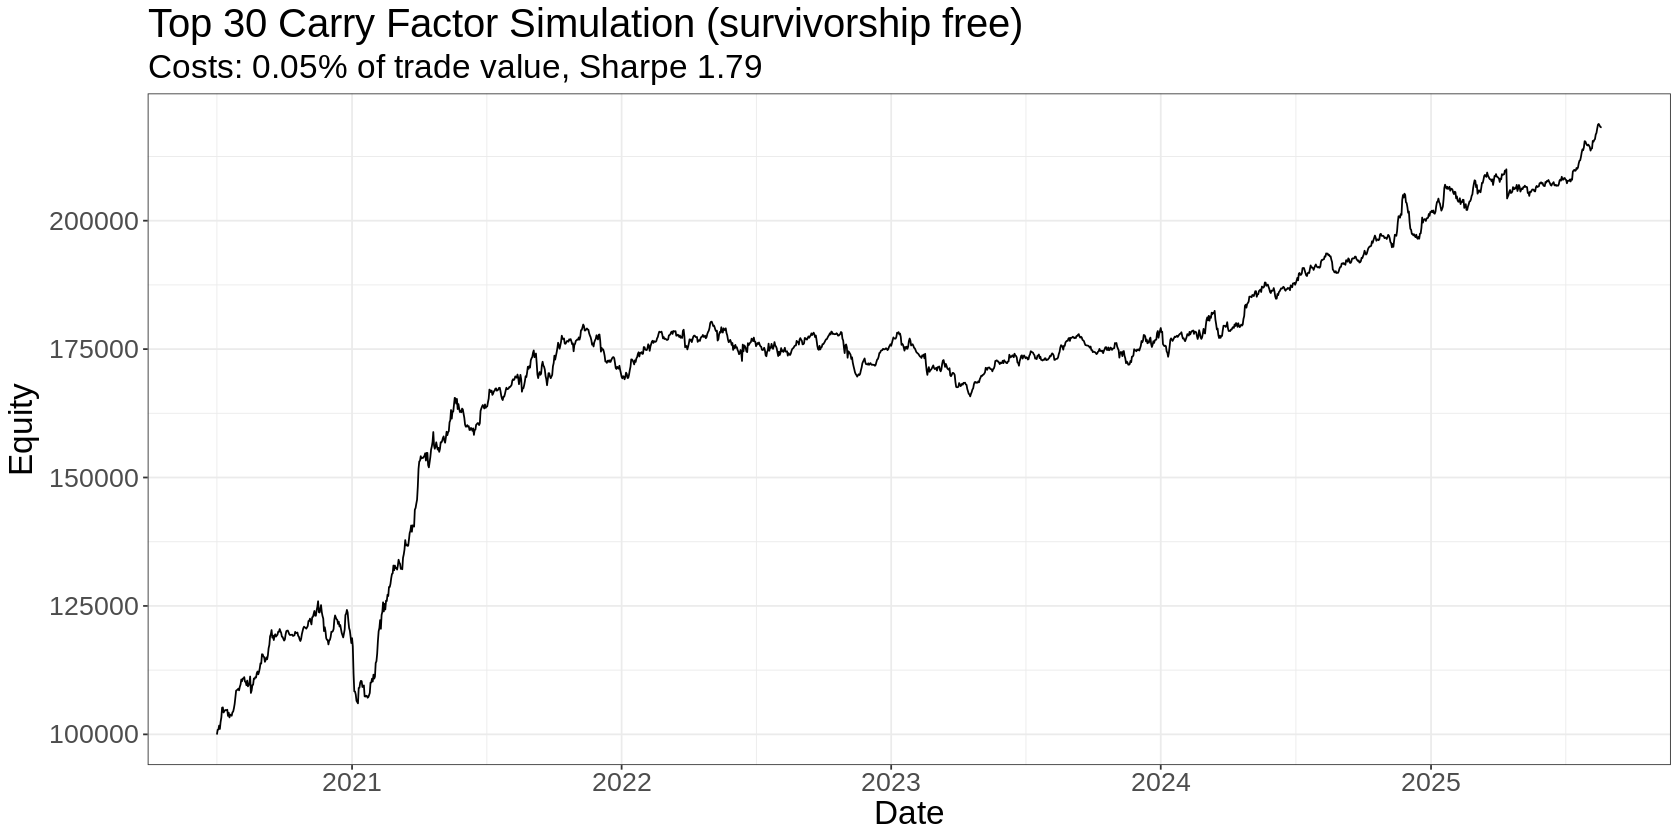
It turns out that’s not necessarily true, and that there’s a perfectly good carry trade on a universe of the top, say, 30 cryptocurrencies by market cap.
This is not new and not the main point of this article.
This is where it gets interesting
I really like Hyperliquid.
I like the tech, the user experience, and the stuff people are building.
Naturally, I wanted to move my Binance carry trade onto Hyperliquid. I started click-trading an admittedly dodgy version of it, using it as a chance to get to know the platform, and expecting the returns to flow.
Except, they didn’t.
Nothing remarkable about that, on the face of it. These sorts of trades don’t make money every week or every month. But the results looked surprisingly different from what I was seeing on Binance, which I was still trading in parallel.
I did a bit of digging, expecting it to be down to differences in the traded universe and the sloppy implementation I’d been running with on Hyperliquid.
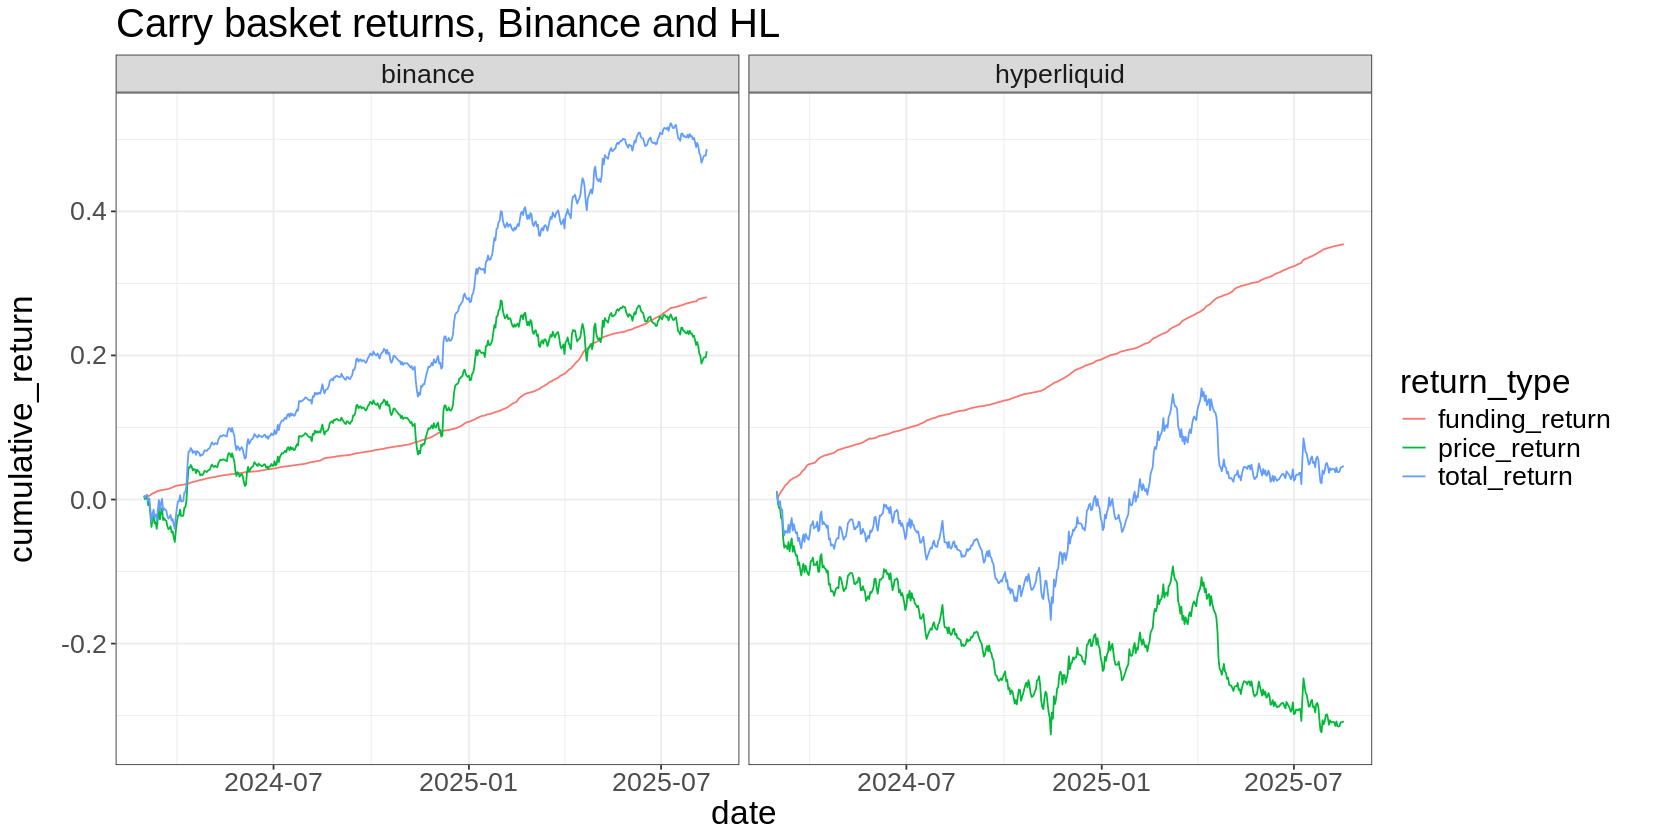
Instead, I found that carry returns on Hyperliquid have an entirely different character from carry returns on Binance:
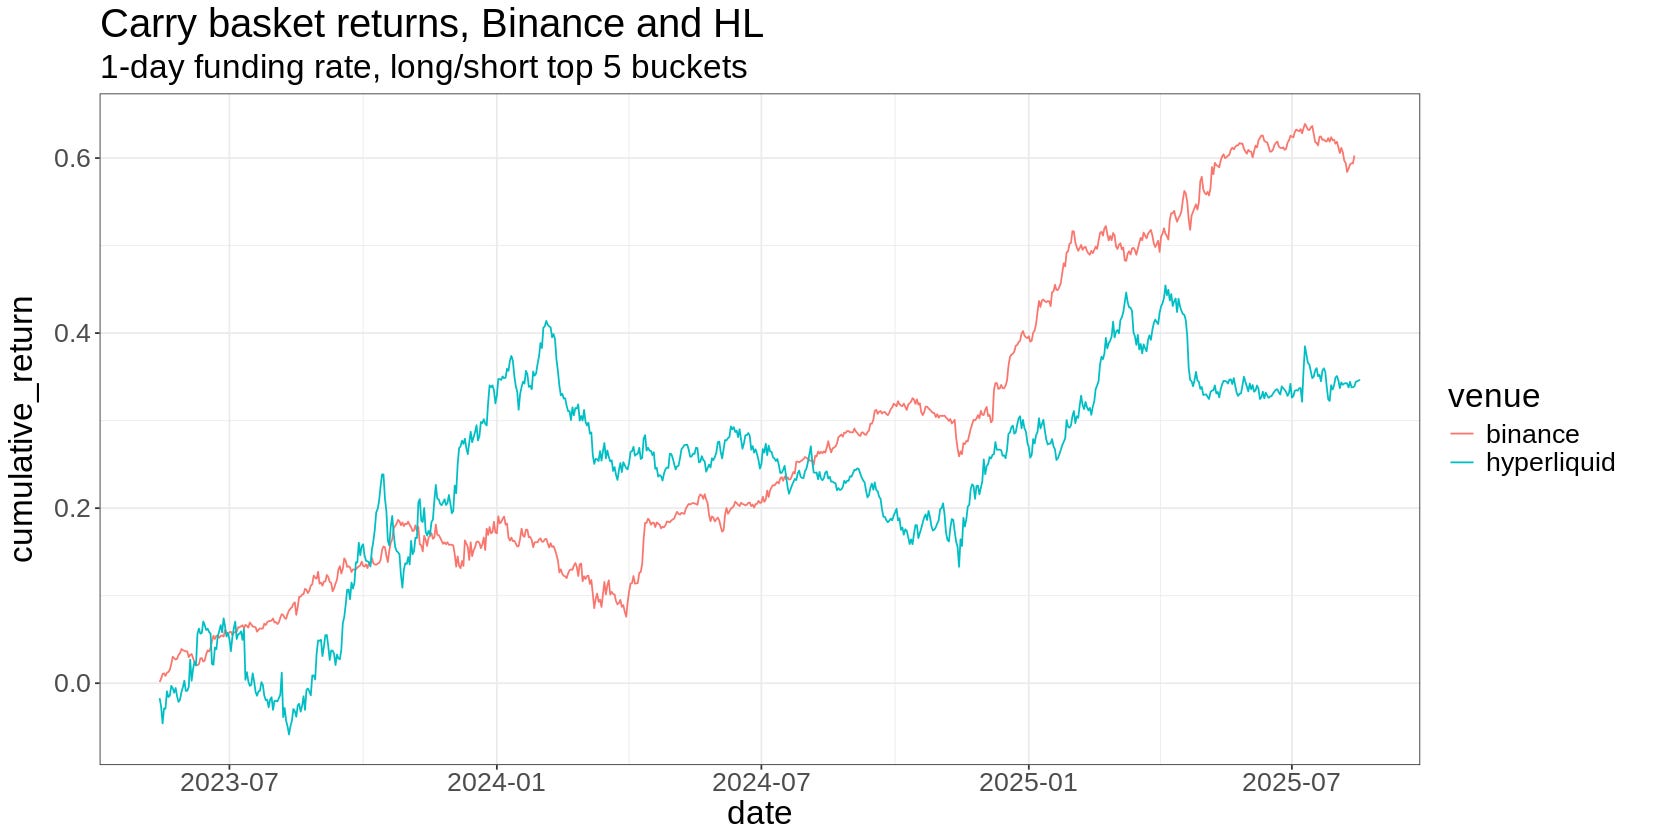
That plot represents frictionless returns to a simple carry factor over the Hyperliquid (blue) and Binance (red) perpetual futures universes.
Interesting thing 1
The first thing that jumps out is that when Hyperliquid was young (pre-March 2024), carry returns were more than double those on Binance.
Carry on Hyperliquid worked beautifully for about the first nine months of the platform's life.
This aligns with what others have observed about trading carry on early-stage projects: it tends to work crazy well initially, then changes as the platform matures and trader demographics shift. Read Scott’s excellent thread on this phenomenon here.
There's probably a liquidity component at play. In the early days of a platform, careless FOMO trading will push thin markets in ways that tend to revert in line with carry positions.
Example: excess demand for leveraged exposure pushes the perp up relative to spot, a lack of liquidity exacerbates the move, and funding blows out, creating a short carry signal. Moves driven by noise trading tend to revert, so the perp comes back down, and you make money on the funding and the price change, on average.
But as platforms mature and different players enter, this dynamic changes.
You could probably pinpoint this transition by looking at traded volume or open interest metrics to identify when carry started to falter on Hyperliquid - though I haven't done that analysis yet.
Interesting thing 2
Since early 2024, the Hyperliquid carry factor has gone nowhere, while the Binance version has returned about 50% (in the frictionless world of that plot).
This is what surprised me.
My first thought was that the different universes of perps available on each venue must explain the difference. But when you control for that by only using the overlapping universe, you still get a significant divergence.
That leaves the carry signals themselves as the culprit.
And indeed, if you get your carry signals from Binance and trade them on both venues on the overlapping universe, you’ll find that performance starts to marry up.
So what’s going on here? Why would carry signals based on Hyperliquid funding rates underperform?
Decomposing those frictionless carry returns provides a big clue:
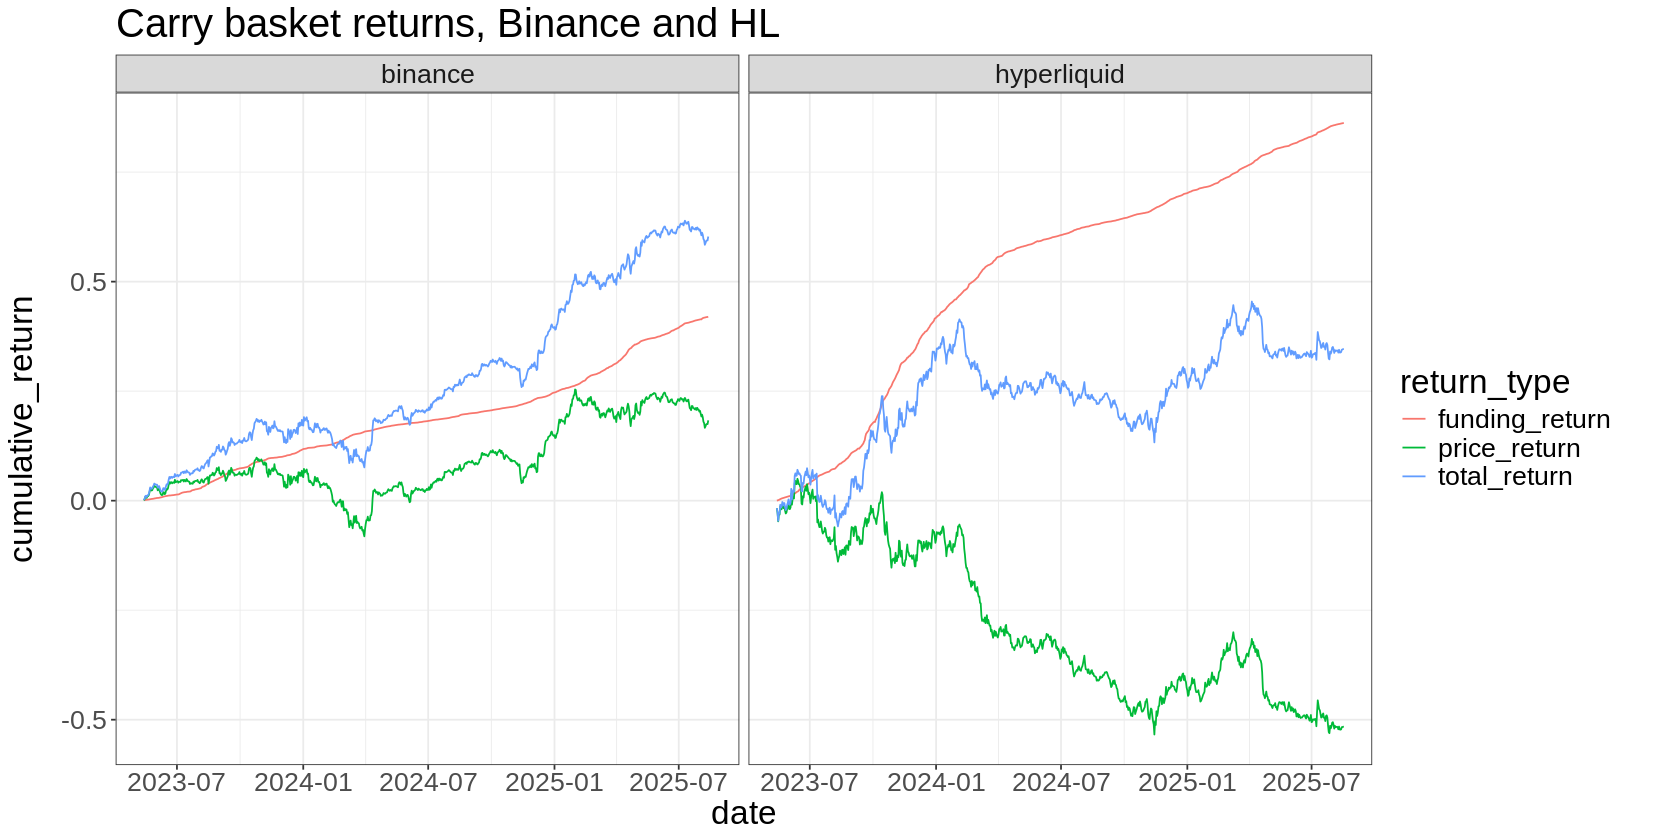
On Binance, price change returns (green) were positive - your carry trade paid you in funding and from being on the right side of changes in price
On Hyperliquid, price changes consistently work against you (post 2024), wiping out funding gains.
Interestingly, this was true even in the glory days of carry on Hyperliquid (pre-2024), but it really accelerated early in 2024 to the point where it swamped funding returns:
Say you get a carry signal on Binance that tells you to long a certain perpetual future. That happens when the perp has gone down relative to spot. The chart implies that when you take this long, price tends to revert in your favour, on average.
On the other hand, if you get a long carry signal on Hyperliquid, the chart implies that price continues to go in the direction that caused the funding rate to decrease - that is, against your long position, on average.
(You might expect this to apply to both the long and short sides - but as you’ll see below, it seems to be constrained to the Hyperliquid long carry signals).
I naively assumed that trading carry on Hyperliquid would be far superior to doing it on Binance because the funding rates are typically so much higher. But that ignores the role played by the other return driver - the change in price.
But it turns out there’s yet more to this story…
Crypto’s dumping ground?
Here’s a theory that fits the data we’ve seen so far:
Binance: High funding rates come from uninformed FOMO traders piling in without much edge. This crowding typically reverts. So when you short something with high funding, you collect the payments while prices drift in your favour, on average.
Hyperliquid: High funding rates come from informed traders with genuine conviction. When you short something with high funding, you collect payments, but the price continues moving against you, overwhelming what you earn.
That begs the question: Who might these informed Hyperliquid traders be?
Comparing recent factor plots for the carry factors on Binance and Hyperliquid provides a clue:
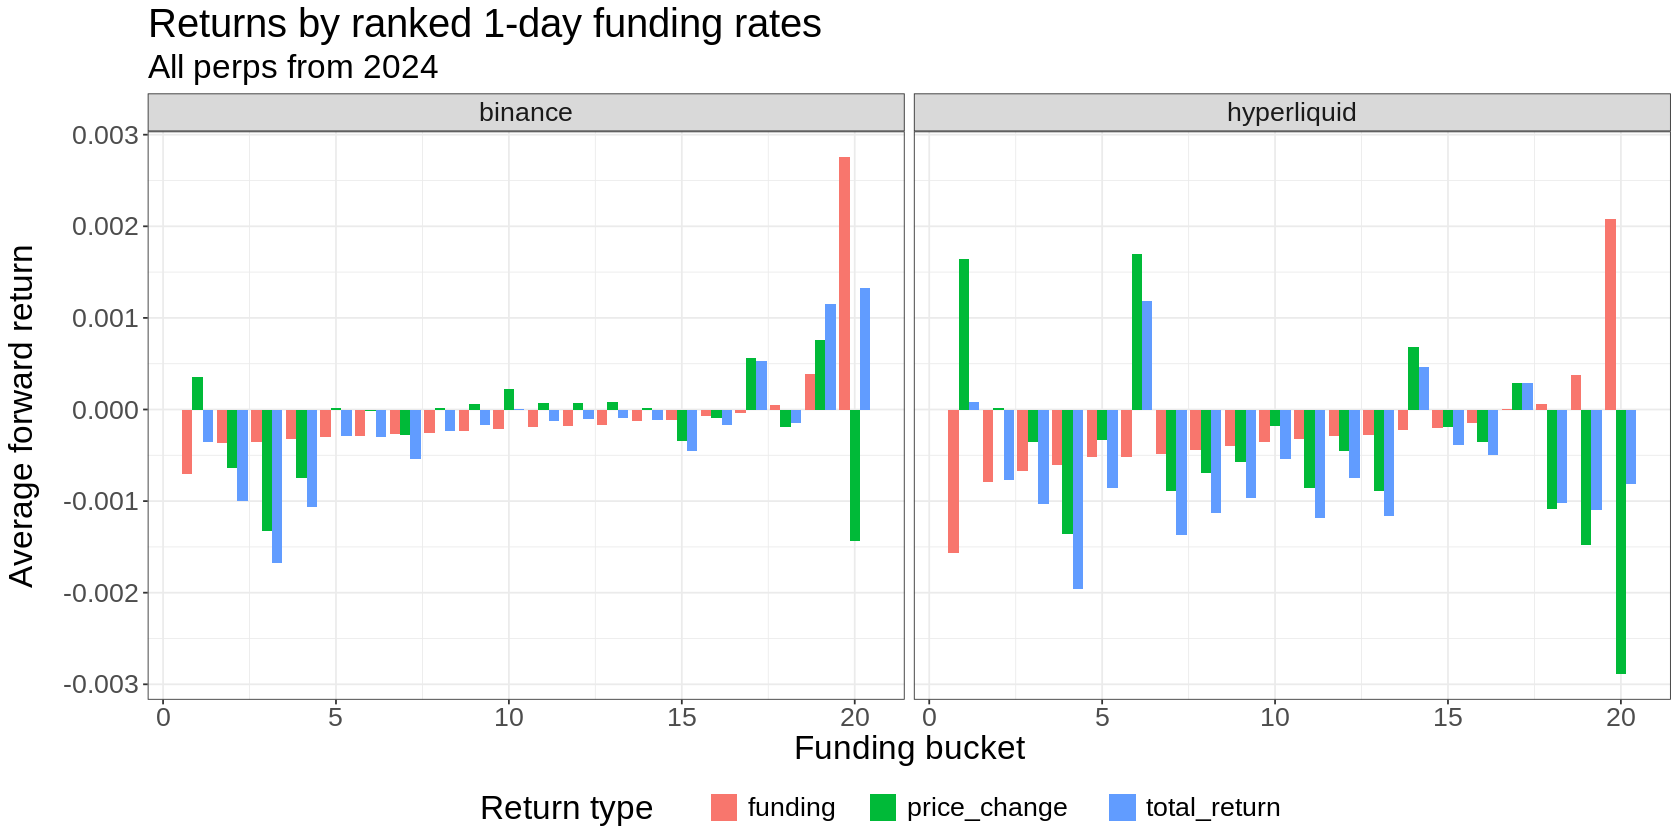
The short side of the carry trade (buckets 1-5) looks similar on Binance (left plot) and Hyperliquid (right plot).
But look at the long side (buckets 16-20).
We see significant negative average returns to Hyperliquid carry in this region, while on Binance, it behaves largely as expected.
Making this really clear:
The stuff that paid us to get long on Hyperliquid - perps trading at a discount to spot - went down a lot, swamping funding returns. On Binance, that didn’t happen.
This seems to be the key difference. So the obvious questions are:
What sort of crypto assets tend to go into the top Hyperliquid funding buckets?
Who’s doing the selling that’s driving that funding?
Why don’t we see the same thing happening on the other side?
And why would the trade be happening on Hyperliquid and not on Binance?
To me, this points to people holding crypto assets they know or suspect to be worthless, but are unable or unwilling to dispose of in spot markets (perhaps due to lockups, more likely so that others can’t track their wallet and get in on the act), so they dump them via perpetual futures markets.
And Hyperliquid being anonymous while Binance requires jumping through various KYC hoops suggests that the people doing the dumping on Hyperliquid would prefer to do it quietly.
And the fact that it happens due to selling, but not due to buying, supports this idea. It’s much more plausible that worthless shitcoins get pumped and shorted than it is to dump something with inherent value and buy it cheap.
I suspect that, rather than being an inherent property of “shorts pay longs” carry on Hyperliquid, those negative returns on the right-hand side of the carry factor plot are driven by the subset of perps that have been subject to this “exit liquidity” effect.
It’s almost certainly happening on Binance too, but perhaps the scale at which it’s happening on the two venues is different.
This won’t come as any surprise to people who’ve been trading this stuff for a while, and there are myriad reasons to short dogshit crypto besides this small bit of analysis.
But the fascinating thing is seeing it play out in the data - and deriving potentially tradeable insights as a result. More on these below.
Funding rate asymmetries
There's also a clear asymmetry in the funding rates themselves. On the subset of common Hyperliquid/Binance perps, when the funding sign is aligned across venues:
When longs pay shorts on both venues, Hyperliquid's rates are higher on average
When shorts pay longs on both venues, Binance's average rates are more extreme, but the difference is smaller by an order of magnitude
I’m not entirely sure what to make of this. I would have guessed that Hyperliquid’s “shorts pay longs” would be more extreme due to the informed selling that would be driving a deeper wedge between the index price and the perp on Hyperliquid, resulting in more extreme funding. But we see the opposite. Perhaps it’s due to differences in funding calculations. If you have any ideas, I’d love to hear them.
Turning insight into (potential) edge
This kind of research can convert observations into potential trades:
The Binance Carry Basket:
Select the top 20-30 Binance perps by rolling volume or market cap
Rank by 3-day funding rate (or some other sensible carry metric)
Weight by equal volatility (controls risk better than equal dollars)
Trade on Binance or Hyperliquid using Binance signals
The earlier chart shows a reasonably accurate after-cost simulation on Binance
Don’t trade naive long/short carry on Hyperliquid without accounting for the “exit liquidity” effect
Since “exit liquidity” shorting would be happening on Binance too, I suspect there’s an even better carry trade to be had by going into higher-funding perps while removing those subject to this phenomenon. Targeting the top 20-30 universe is essentially one way of doing that.
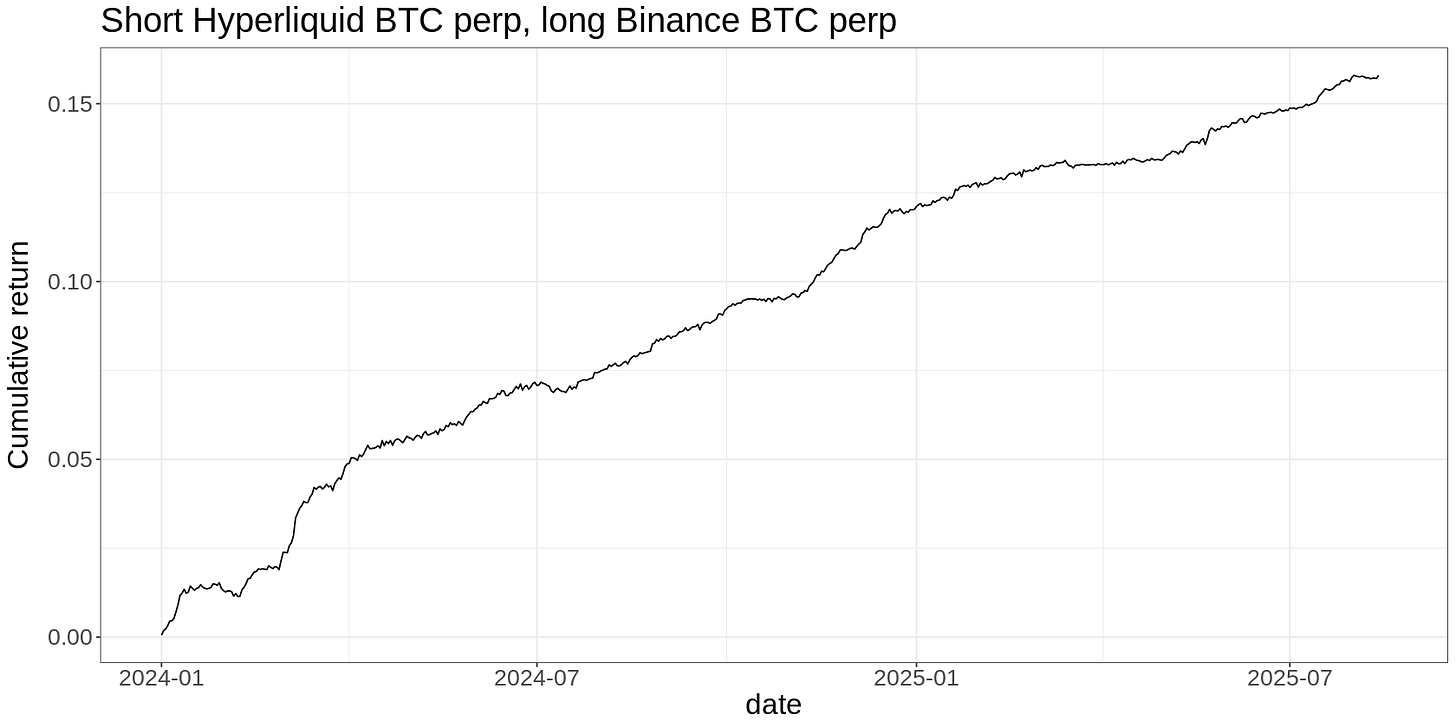
The Cross-Venue Funding Trade:
When funding is positive on both venues (pretty much all the time for things like BTC - below)
Short on Hyperliquid, long on Binance for the same asset
Harvest the funding differential while remaining delta neutral
The chart below shows frictionless cumulative returns to this trade on BTC (no costs)
The New Platform Carry Play:
Identify newly launched perpetual futures platforms
Deploy carry strategies early in their lifecycle
Monitor volume/OI metrics to identify when the edge might be deteriorating (or just trend follow your own equity curve)
Be ready to pivot or exit when you see signs of platform maturation
Requires solid execution skills and lots of babysitting
Pile on With Those in the Know:
When you find something that insiders are shorting, get in on the action.
Extreme “shorts pay longs” carry is a result of such activity, but it isn’t the most direct way to spot it.
Instead, keep an eye on new listings. The classic indicator of insider selling is rising open interest while price consistently falls.
Be careful - these are prone to short squeezes as insiders close their positions once they’ve made their money.
Hyperliquid Funding as a Trend Overlay (not my favourite):
Since Hyperliquid extreme “shorts pay longs” funding predicts further price declines on average,
Use as an overlay for trend (and other) strategies, particularly on the short side.
Will likely be of marginal benefit, unless you’re actually trading the stuff in the Hyperliquid carry buckets 16-20.
Better to trade this “exit liquidity” effect directly, in my opinion.

Caveats
You can probably make a long/short carry trade work using Hyperliquid funding rates by constructing a factor that accounts for the “exit liquidity” effect. But it seems simpler to me to just get your carry signals from Binance.
The potential trades above are just that - potential. The Binance carry basket trade I have more confidence in than the others. The simulation is reasonably accurate, and I have some history trading it, so I understand the trade-offs. The others need a bit more work to understand the trade-offs involved in actually trading them.
Why this matters beyond these specific trades
The most valuable trading edges often come from spotting something that doesn’t match what you think you know about the world and asking, "Why?"
When carry on Hyperliquid didn’t align with what I thought I knew, digging into the "why" revealed something more valuable - a deeper understanding of market participants and their goals and constraints, which in turn leads naturally to new, potentially tradeable insights.
This highlights something fundamental about markets: they're complex adaptive systems with participants who have different motivations, information, and time horizons. The same signal can mean completely different things in different contexts.
A funding rate on Binance might signal uninformed retail crowding ready to revert, while on Hyperliquid, it might signal insiders taking advantage of their last chance to get out.
This is why I find this work so rewarding. It's not just about finding patterns - it's about understanding what's driving those patterns and using that understanding to build a more robust portfolio.
Sometimes the best opportunities come from the market telling you that you're wrong, and then figuring out why.
Updates
15 Sept 2025: The Original article underestimated carry returns. Relevant plots updated.
Brillaint stuff, loving these posts! Thank you.