
How Wealth Managers Pay You to Trade
A simple, low-touch, retail-friendly edge
I’m going to show you a trade I’ve been doing for years. It’s simple, it’s worked really well, and I would bet on it persisting - even if every indie trader reads this article and decides to do it.
This edge has some things in common with everything I trade:
There’s a real-world, plausible underlying mechanism
It’s based on providing a service to the market (rather than making a prediction)
It’s reasonable to think that I, an indie trader without special infrastructure or resources, can compete
This is the essence of Edge Alchemy - a framework for thinking about edge as an indie trader.
You’ll get three things from this article: an edge you can trade, the structural reason why it’s likely to persist, and a walkthrough of how I’d approach analysing this kind of effect.
If you want the code, you’re welcome to it (link below) - but I want to focus on the thinking process.
Let’s dive in.
The Rebalancing Problem
You already know this, but many wealth managers hold some variation of the same portfolio: roughly 60% stocks, 40% bonds. Maybe it’s 70/30. Maybe it’s 50/50. The exact split doesn’t really matter.
What matters is they’re holding both, and they’ve all got a rebalancing problem.
Here’s how it works.
Say you start the month with exactly $60,000 in SPY (S&P 500 ETF) and $40,000 in TLT (20+ year Treasury bonds). Perfect 60/40 split.
Now things happen. Markets move. By mid-month, stocks have rallied 5% while bonds are flat. Your portfolio is now roughly 61/39 - $63,000 in stocks, $40,000 in bonds.
You didn’t want 61/39. You wanted 60/40. So what do you do?
You sell some SPY. You buy some TLT. You rebalance.
This isn’t a choice - it’s a requirement. If you let your portfolio drift too far from your target, you’re taking more risk than you signed up for. You might even have a mandate that explicitly dictates what you hold.
When Everyone Does the Same Thing
Now here’s where it gets interesting.
The wealth manager isn’t the only one doing this. There are all sorts of funds, robo-advisors, and “balanced growth” portfolios, all in roughly the same position, doing roughly the same maths, arriving at roughly the same conclusion.
They need to sell the thing that outperformed and buy the thing that underperformed.
And while they don’t all rebalance on the exact same day, they cluster. Lots of institutional rebalancing happens around month-end. Quarterly rebalancing happens at quarter-end. You get the idea.
This creates noisily predictable, forced flows. These aren’t people who want to sell stocks at current prices - they have to. They’re not buying bonds because they think bonds are cheap - they’re buying bonds because their rules require it.
And forced flows distort prices.
This is genuinely important: when someone is forced to trade, they’re what we call “price-insensitive”. They’re trading for reasons other than maximising the expected value of their trades. They’ll accept worse prices than someone who’s choosing to trade.
And when there’s a whole heap of price-insensitive participants all doing the same thing? Well, that smells a lot like edge.
How I’d Test This
So here’s the hypothesis: if we can identify which asset outperformed during the first part of the month, the underperformer should outperform as we approach month-end, when rebalancing pressure is likely to be greatest.
The first step is simple. Pull daily data for SPY and TLT going back as far as you can get it (I used data from 2007). You can get this from Yahoo Finance - nothing fancy.
Then ask a straightforward question: If I know which asset outperformed during the first 15 trading days of the month, can I predict which will outperform during the last ~7 trading days?
Why 15 days? Because it’s roughly two-thirds of a trading month, and it gives us a reasonable window to identify the outperformer before month-end rebalancing kicks in.
Could you use 10 days? 20 days? Sure. But 15 seemed reasonable and shouldn’t really matter much. If it did, then that would be a big red flag. We want stuff that’s fairly robust to the actual implementation details.
Here’s what that relationship looks like:
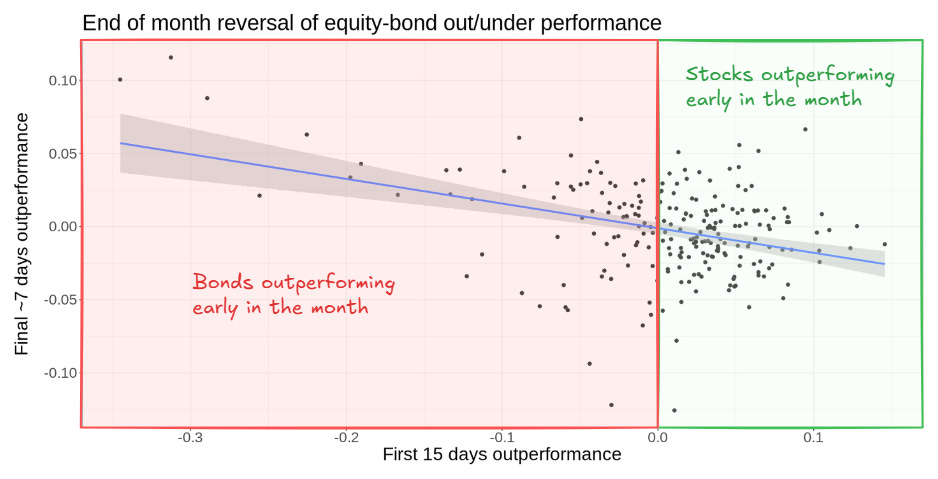
That’s about as clean a relationship as you’ll find in markets. When stocks outperform bonds early in the month (positive x-axis - green), bonds tend to outperform stocks late in the month (negative y-axis). When bonds outperform early (negative x-axis - red), stocks outperform late (positive y-axis).
The slope implies a clear, albeit noisy, reversal effect.
Side note - Where did this idea come from?
One of the most common questions I get is “How do you come up with trading ideas?”
And this article is a sanitised version of the research approach that might give you the sense that I came up with all this by myself, and then progressed through the research in a scientifically rigorous fashion.
I didn’t. The actual process went more like this:
I first read about this effect in a JPM research note. Then I did some simple data analysis to verify what the note said. Then I talked to people about it. Then I backwards-rationalised a structural mechanism while iterating on further data analysis.
The point is that for the purposes of showing you how I approach this, I’ve kind of given you the idealised, “scientifically pure” version. Reality is messier and more iterative.
Importantly, the process is polluted by knowing roughly what happened before you did your data analysis, and therefore, it depends on you, the researcher, not bullshitting yourself. A simple foil to this is to approach it with an attitude of paranoia that you’re wrong rather than hope that you’re right.
Finally, there are no points for originality. Cast a wide net for ideas that others have already had.
Back to the task at hand…
Does It Hold Up?
One chart proves nothing. So the next step is often to check if it holds up across different time periods.
If it only worked during 2008 or post-COVID, we might be looking at random noise, not a real edge.
We don’t have a ton of data here (only one observation per month), so I broke the data into two chunks, 2007-2016 and 2017-2025.
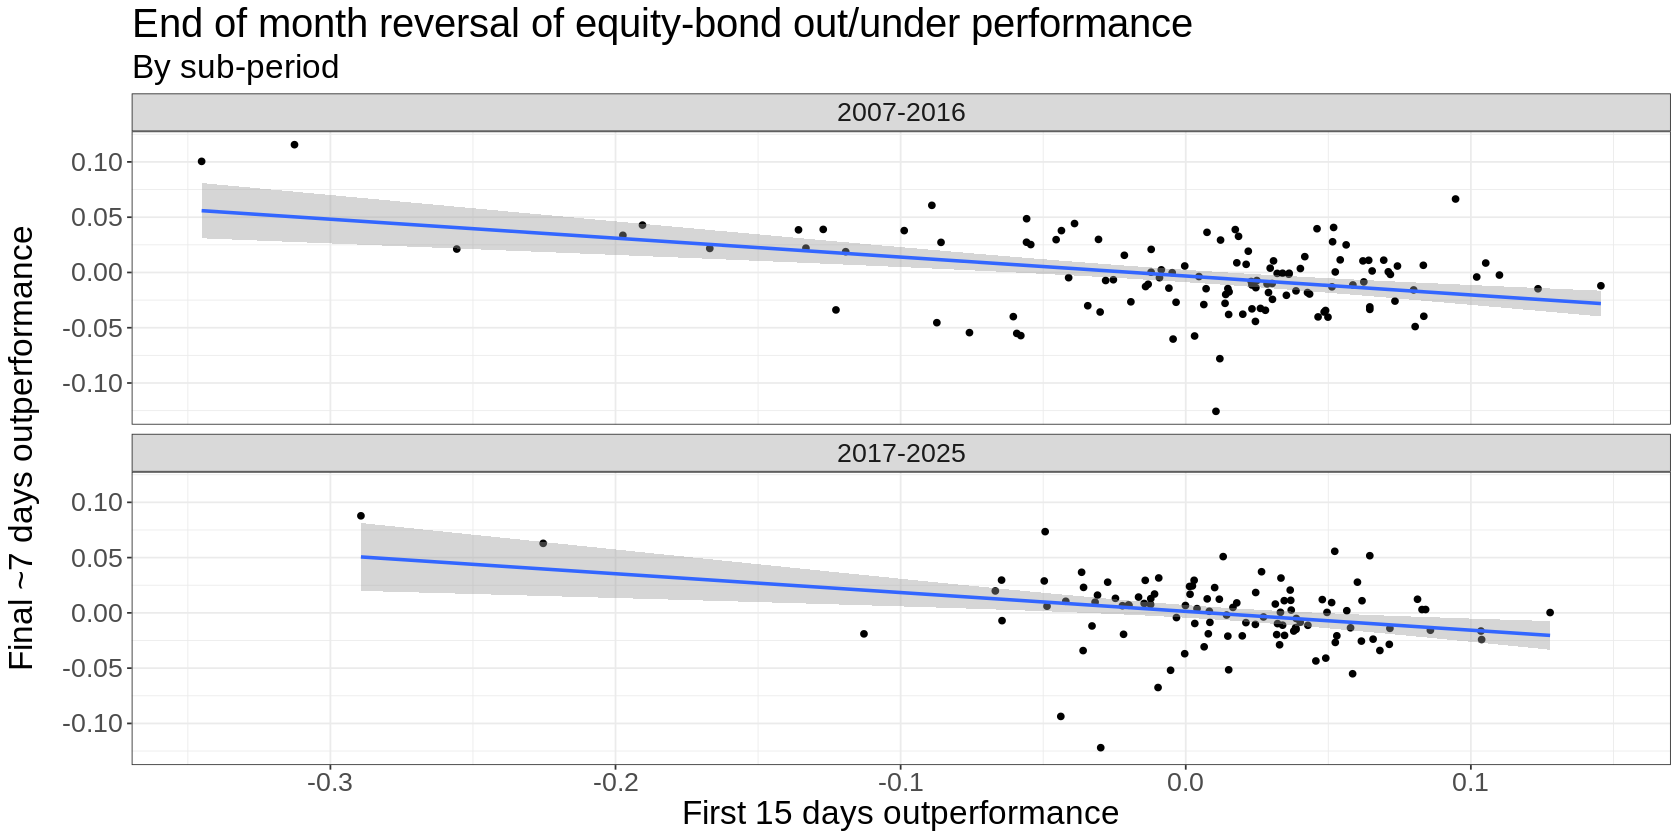
That’s a nice result - it looks similar in both periods, so we get the sense that it’s been consistent over time. That’s a small bit of evidence that it really is based on a structural effect rather than just randomness.
Competing Evidence
This whole game of researching trading ideas is an exercise in weighing up competing evidence. Nothing is ever totally clear-cut, and the real art lies in evaluating both sides of the coin and deciding whether something is worth throwing money at, and if so, how much.
So far, we’ve seen some compelling evidence on the “for” side of the ledger (plausible underlying mechanism, shows up consistently in the data). But there are some things that potentially belong in the “against” column too.
Do Outliers Dominate?
It would be reasonable to look at those scatter plots and wonder whether the effect would disappear if you removed a few outlying observations. So let’s take out any early-month return that’s greater than 5%:
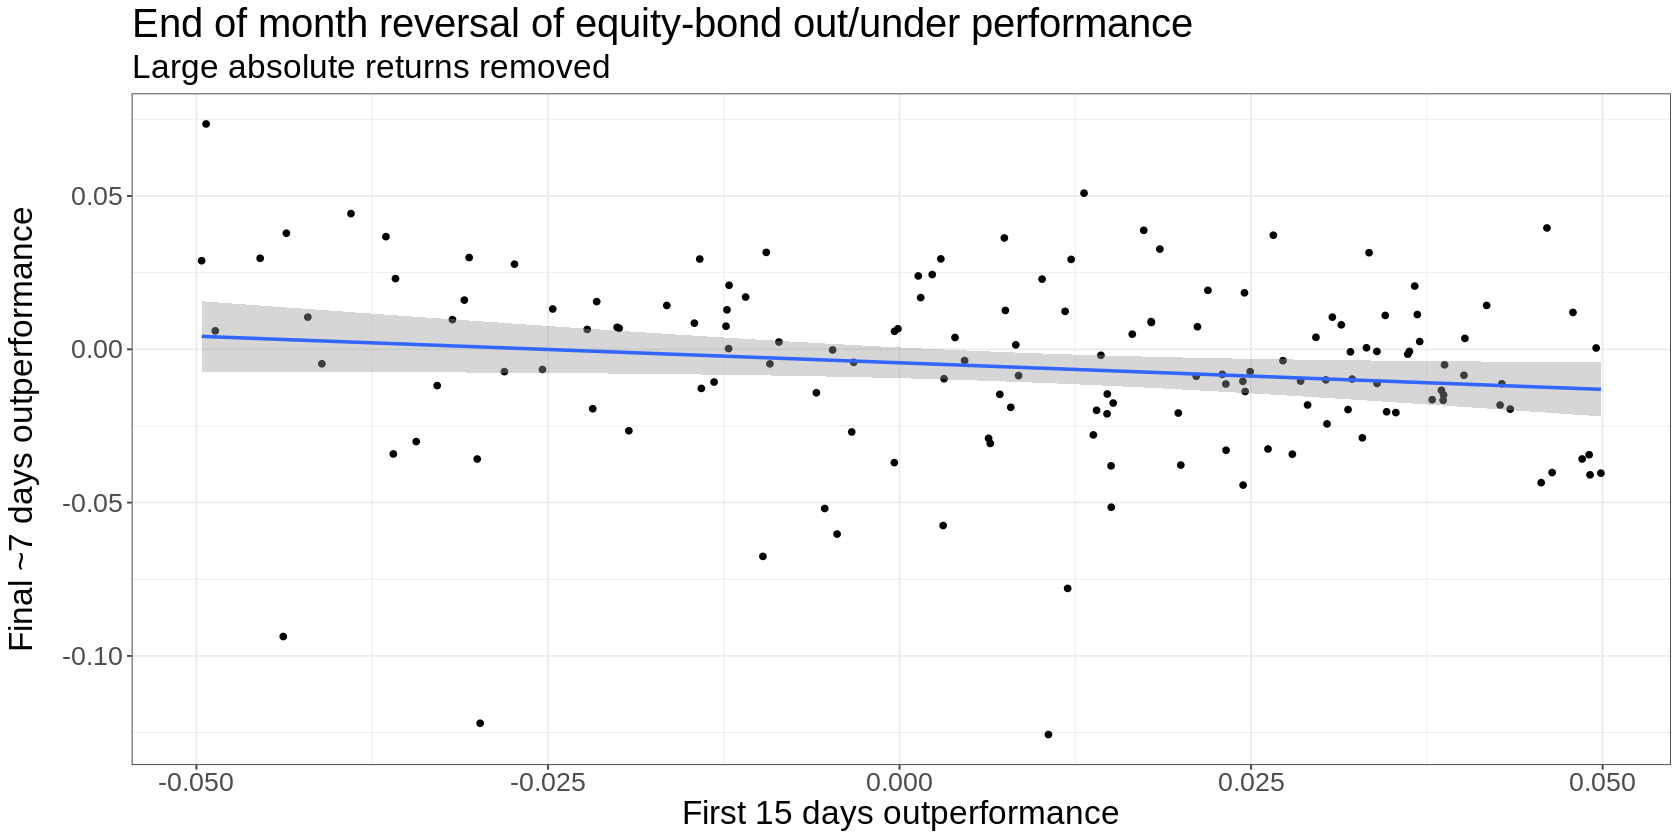
The effect is still there, but it does look a bit weaker and noisier.
Not Much Data
We don’t have as much data as we’d like - only one observation per month. So every insight suggested by our analysis needs to be tempered with that.
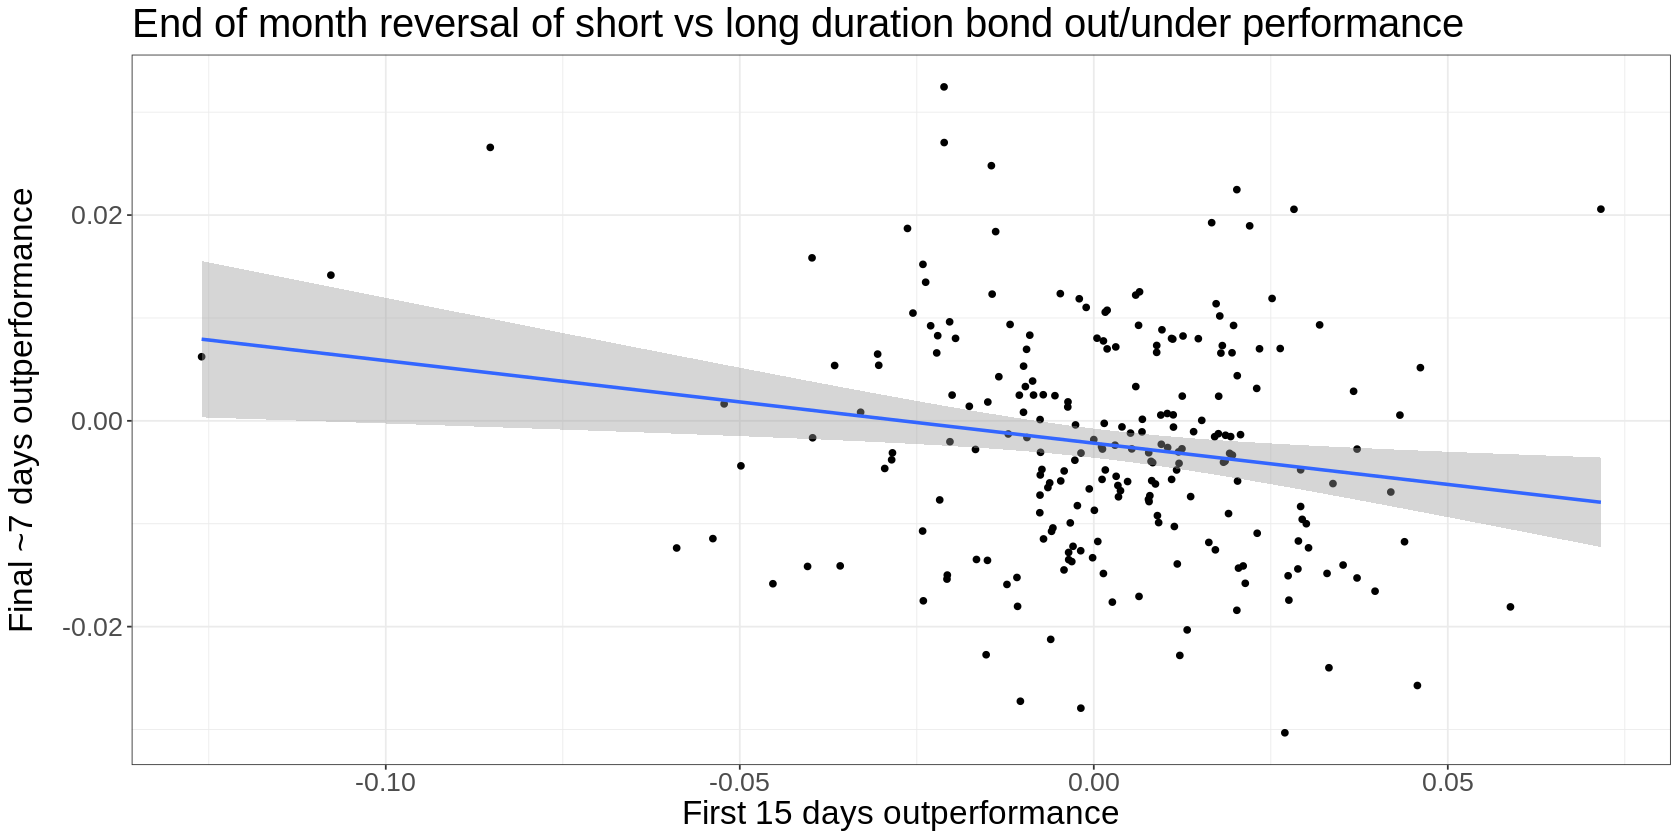
One way to get more data is to think about where this effect would show up if our hypothesis were correct, and then go test it there as well.
Our hypothesis is based on price-insensitive rebalance flows. So let’s think about places where wealth management might need to rebalance. This might include portfolios with target exposures to:
Short and long duration bonds
Small and large cap equities
Developed and emerging market stocks
etc
Here’s what it looks like if we trade rebalance flows between ten-year and 20+ year treasuries (IEF and TLT):
And here’s large vs small cap US stocks (SPY and IJR):
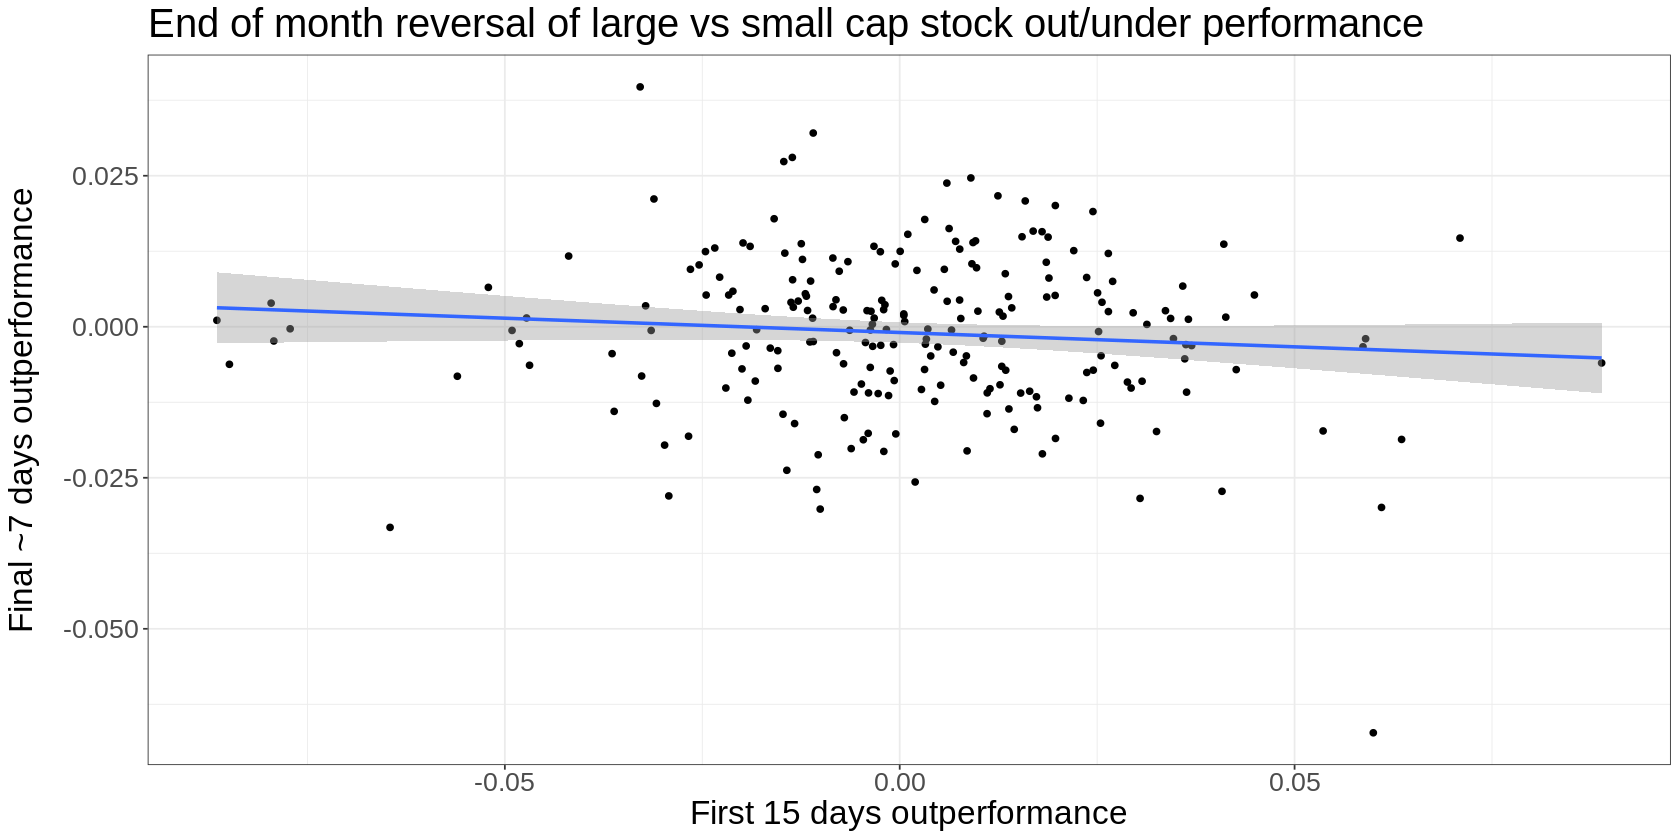
While the effect isn’t as pronounced (we wouldn’t expect it to be), it does show up. So that’s a nice piece of evidence in favour of our idea.
Why This Persists and Why We Can Do It
I think this edge will continue to work because the underlying driver can’t really change.
People will continue to hold balanced stock/bond portfolios. They will have to rebalance. They have mandates, regulations, and client expectations that require it. Wealth managers don’t rebalance because they think the underperformer is cheap. They rebalance because that’s their job. The flows are forced, not discretionary. And forced flows move prices.
In aggregate, those rebalance flows are enormous - way bigger than you, me and an army of indie traders could make a dent in.
But what about big, sophisticated players? Why don’t they do this trade in size and eat all of the edge themselves?
The answer is because the edge kind of sucks.
It only comes around once a month. It’s noisy, which is another way of saying it only plays out in the long run. It’s not a home run every single month (far from it).
If you’re a big, sophisticated trader with teams of people, great infrastructure and resources, you’re not likely to be all that interested in this sort of trade.
Which is great news for us.
It means that we can realistically compete here.
Picking the right games is an enormous part of running a decent indie trading operation. It takes a little humility to deliberately seek out where the going is easy. But I like money more than I like feeling smart.
How to Actually Trade It
There are a few variations for doing this. Personally, I just trade the long side by overweighting either stocks or bonds rather than fighting the risk premium of holding them.
But you could make an argument for doing it long-short as well. Totally up to you.
Here’s how I do it:
Around the 15th trading day of the month (roughly day 20-22 on the calendar), check which asset outperformed since the start of the month.
If SPY outperformed TLT → Buy TLT or ZB
If TLT outperformed SPY → Buy SPY or ES
Hold until month-end. Close the position. Repeat next month.
That’s it. No complicated signals. No optimisation. You can literally eyeball this on TradingView by plotting the SPY/TLT ratio and seeing whether it went up or down.
You don’t need to time it perfectly (you can’t). The rebalancing flows are noisy and distributed over several days. You’re not trying to catch the exact moment of maximum flow - you’re positioning yourself ahead of the general pressure.
If you don’t have portfolio margin, you can also consider doing this with leveraged ETFs (UPRO, TMF). Even though they’re expensive and subject to volatility drag, they’re not a bad option for short-term tactical trades like this.
If you were really keen, you might consider stacking a bunch of rebalance trades, such as the long/short duration bond and small/large cap stock examples.
The Results
Here’s what a simple ETF implementation looks like (before costs):
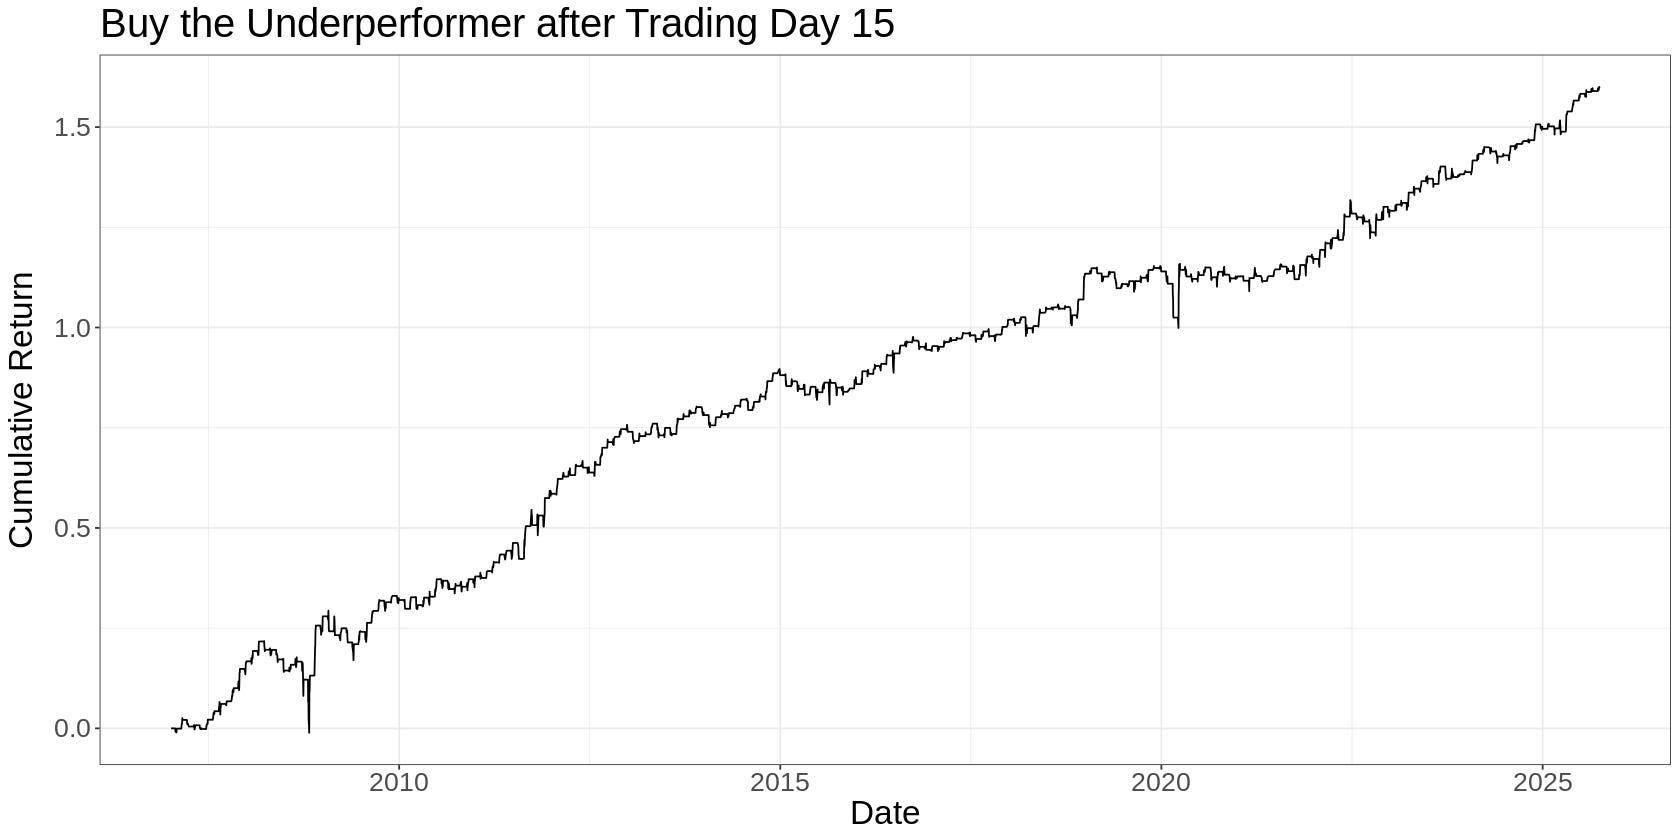
This is just buying the month-to-date underperformer on day 16 and holding to month-end. No leverage. No shorting. No position sizing. Just “buy this one or that one and hold for a week.”
A few observations:
It’s not smooth. Some months lose money. That’s fine and normal. We’re trading a probabilistic edge, not a guarantee. There are many months where other things happen that swamp any edge we might have in that month.
It’s been particularly strong recently. My guess is that the large divergence between equity and bond performance has meant more frequent and larger rebalancing. But that’s just a guess - I don’t really know.
A fair question at this point would be, “This trade has made money, but how does it compare to just holding SPY?”
Here’s a comparison of the strategy to holding SPY for the same few days at the end of the month:
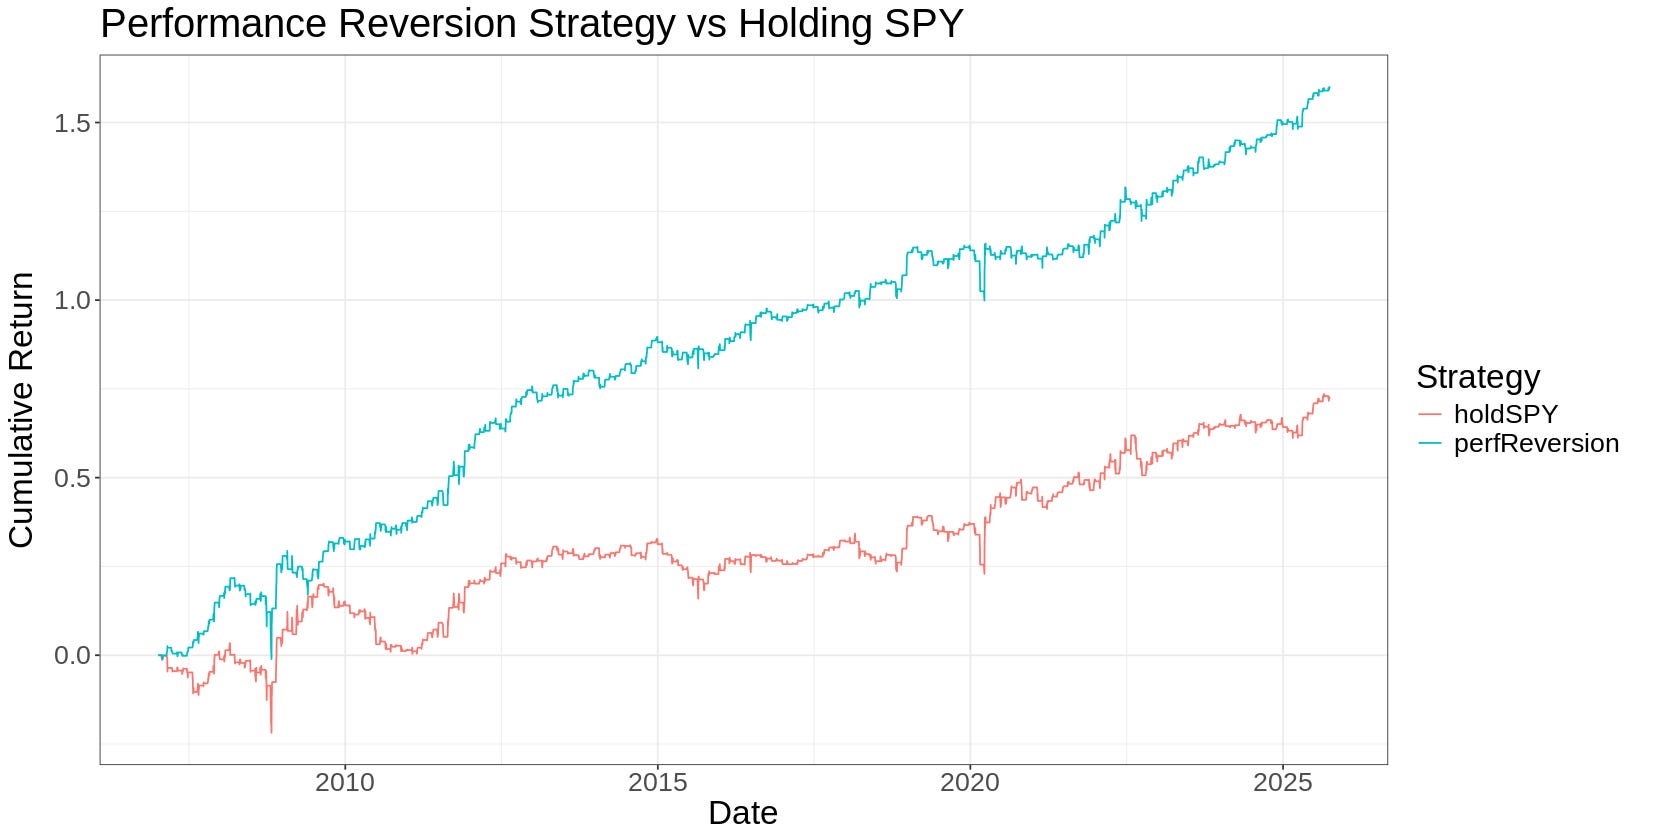
It’s done notably better than just holding SPY for those same few days at the end of the month.
Could you improve this?
Probably. You could remove timing luck by trading into and out of the position over a few days, add position sizing based on the magnitude of the outperformance, trade futures for better capital efficiency, and find other asset pairs with similar dynamics.
But you don’t need to. This simple approach is just fine.
On Trading Mediocre Edges
One insight that I hope you take away is that indie traders should embrace edges that are somewhat unattractive to the bigger players. We don’t want to be in an arms race we can’t win, or wind up being the sucker at the poker table. Minimising competition is key.
But trading mediocre edges doesn’t mean you have to resign yourself to mediocre returns.
The key is understanding that the portfolio does the heavy lifting, not any individual strategy.
When I started trying to trade, I had this completely backwards. I was focused on building a trading strategy with a perfect equity curve rather than thinking about what edges were realistically available to me. From conversations with others just starting out, I think this is a pretty common mistake.
Through sensible portfolio construction that combines multiple mediocre edges, you can get something much greater than the sum of the parts.
For example, this is an after-cost simulation of a portfolio that trades a handful of simple, low-touch, retail-friendly edges, including the one we looked at here (the colours represent the dollar exposure to the different assets traded, profits capitalised monthly):
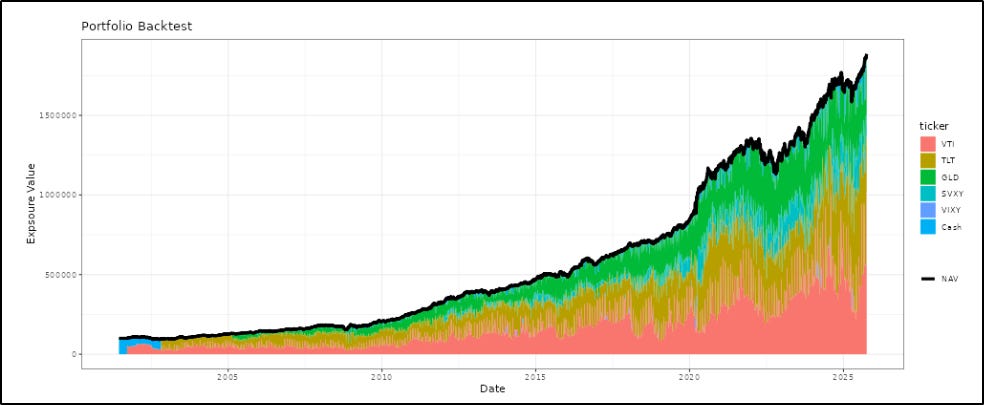
None of the individual edges shoots the lights out. But together, they delivered something that most of us would be quite happy with.
Final Word
This is a very simple idea, but this approach is conceptually how I’d tackle analysing any potential edge. Here’s a summary:
Start with an idea or observation based on a real-world effect. It doesn’t matter where you get it from - no prizes for originality. In this case, everyone holds similar portfolios and must rebalance.
Form a testable hypothesis. Underperformers should outperform into month-end when rebalancing happens.
Test it simply. Don’t overcomplicate the initial analysis. Do the simplest thing you can think of. Approach it with an attitude of seeking to understand rather than trying to build a strategy (that will come naturally once you understand it).
Seek out contrary evidence. Look for evidence that you might be wrong. Test the holes in your analysis. Think about what assumptions you’re making. In our case, we dug into the consistency of the effect through time, the dominance of outliers, and the lack of data.
Weigh the evidence. To be honest, this one was kind of a slam dunk. Pretty much all the evidence pointed in the same direction, but often that won’t be the case. Usually, you’ll have to weigh up competing evidence and make a decision in the face of uncertainty.
Understand why you might be able to compete. This requires acknowledging and accepting the edge’s inherent unattractiveness.
Keep the implementation simple. Don’t add complexity unless it materially improves the trade. This becomes important as you trade more and more edges.
Probably the most important part of all this is the mindset with which you approach your research. At the research stage, you want to be a scientist seeking to understand, not an engineer seeking to build. You want to be paranoid that you’re wrong, not hopeful that you’re right.
If you’d like the code used in this article, feel free to grab it here. It pulls free data, so you should just be able to run it as is.
I really like the approach! Do you have an opinion on whether this simple strategy could be implemented via buying calls on SPY&TLT? Want to avoid any left tail risk
This is an amazing article for beginners - kudos!